

By the Banktimer Editorial Team · Published
Banktimer is an independent U.S. consumer-finance publication. Our editors draw on primary and official sources first, such as the CFPB, FDIC, Federal Reserve, and FTC, along with statutes, regulations, and providers’ own agreements and fee schedules. Then we add worked examples and decision tools. Our goal is the most useful, best-supported explanation the sources available to us at the time of writing allow.
This article is general information, not legal, tax, investment, insurance, or financial advice, and reading it does not create a professional relationship with Banktimer. Rates, fees, limits, and rules change, and they vary by state, provider, and contract, so confirm current terms with your bank, lender, insurer, or the agency named in the article before you act. Examples are illustrative unless labeled otherwise. Banktimer is not a bank, lender, insurer, or financial advisor, and we are not responsible for decisions or losses that result from relying on this content. For advice about your own situation, talk to a licensed professional.
If you’ve ever felt like “personal finance” is really twelve unrelated subjects wearing one trench coat, you’re not wrong. Budgeting is a monthly habit. Compound interest is math that rewards patience measured in decades. Net worth is a snapshot, taken once and compared to the last one. Taxes run on a calendar the IRS controls, not you. Emergency funds exist for the one week you hoped would never come. Learning personal finance basics means learning to hold all of these timelines in your head at once — and knowing which one matters for the decision in front of you today.
This guide is Banktimer’s complete reference for building that foundation. It walks through Budgeting, Compound Interest, Cost of Living, Debt, Emergency Funds, Financial Goals, Household Costs, Inflation, Net Worth, Retirement Planning, Saving Money, and Taxes — one pillar at a time, in that order, because each one leans a little on the ones before it. You can’t build a meaningful emergency fund target without first understanding your household costs. You can’t set a realistic financial goal without knowing your net worth trend. Every section follows the same shape: how the concept actually works, what the real 2026 numbers say, the steps to apply it yourself, and the specific mistakes and red flags that trip up otherwise careful people. Where a number is time-sensitive — a savings rate, a tax bracket, a Federal Reserve benchmark — this guide dates it and names its source, because a guide this size only stays useful if you know exactly which parts to double-check next year.
Zoom out far enough and personal finance basics are really just one skill practiced twelve different ways: matching money you have today against needs that arrive on a schedule you don’t fully control. Budgeting matches income to spending. An emergency fund matches savings to bad luck. Retirement planning matches decades of small contributions to decades of future expenses. Once you see the pattern, each new pillar gets easier, because you’re not learning twelve separate systems — you’re applying the same underlying discipline to twelve different time horizons and twelve different kinds of risk.
Use this guide two ways: read it start to finish if you’re building your financial foundation from scratch, or jump straight to the section covering whatever’s in front of you right now — a rate hike affecting your savings account, a debt balance you’re finally ready to tackle, a tax bracket question before year-end.
Personal finance basics aren’t twelve separate skills so much as one skill — matching money to timing — applied to twelve different horizons, from this month’s grocery bill to a retirement that’s forty years out.
As of September 2026, the Federal Reserve raised its benchmark rate a quarter point to 3.75%–4.00%, the first hike in about three years — a genuinely rare moment where savers and debt-holders feel the same policy move in opposite directions on the same day.
Two of the most commonly cited “current” statistics in personal finance — net worth by age and average household spending by category — are both meaningfully stale right now. The Fed’s net worth survey is still running on 2022 data, and the government’s household spending survey is running on full-year 2024 data. This guide labels both accurately instead of passing off old numbers as new ones.
Roughly two in three American adults live paycheck to paycheck in 2026, and that figure barely changes at higher income levels — fixed costs like housing, insurance, and childcare have outpaced income growth for enough households that budgeting discipline alone can’t fully solve it.
Federal oversight of nonbank financial apps has been sharply reduced in 2026 after funding cuts to the Consumer Financial Protection Bureau — which means verifying a savings app, debt-relief company, or “wealth-building” platform yourself, before you hand over money, matters more than it did a few years ago.
The single biggest lever hiding in plain sight across every section of this guide is time: money moved a decade earlier, debt paid a year sooner, or a habit changed a month earlier compounds into a dramatically different outcome than the same action taken later.
Key Numbers to Know
| Metric | Figure (September 2026) | Source / vintage |
|---|---|---|
| Federal funds rate (benchmark) | 3.75%–4.00% target range | Federal Reserve, September 16, 2026 |
| Headline inflation (CPI, year-over-year) | 3.4% | BLS, August 2026 release |
| Top high-yield savings APY | ~4.00%–4.21% | Bank rate pages, September 2026 |
| National average savings APY | 0.38%–0.63% | Bankrate/FDIC survey, September 2026 |
| Average credit card APR | ~20.9%–22.2% | Federal Reserve G.19, Q2 2026 |
| Total U.S. household debt | $18.77 trillion | New York Fed, Q2 2026 |
| Average consumer credit card balance | $6,659 | Experian, 2026 |
| Households that could not cover a $1,000 emergency from savings | 59% | Bankrate Emergency Savings Report, early 2026 |
| Median household net worth (all ages) | $192,900 | Federal Reserve SCF, 2022 data (most recent published wave) |
| Average U.S. household spending | $78,535/year | BLS Consumer Expenditure Survey, full-year 2024 data (released Dec. 2025) |
| 2026 401(k) employee contribution limit | $24,500 | IRS, effective 2026 |
| 2026 IRA contribution limit | $7,500 | IRS, effective 2026 |
Figures above come from the Federal Reserve, the Bureau of Labor Statistics, the New York Fed, the IRS, Bankrate, and Experian; each section below links to the live source behind its own numbers, because rates and averages this size shift constantly and a table only stays honest if you know when it was last checked. Two rows carry an explicit data-vintage note on purpose — net worth and household spending are the two personal-finance statistics most often reported as fresher than they actually are, and calling that out here is more useful than pretending otherwise.
Budgeting
Budgeting is where personal finance basics start, whether you’re building your first spreadsheet or ditching spreadsheets for an app entirely. Get this piece right, and everything else — saving, paying down debt, hitting a goal — gets easier, because you actually know where your money goes. Get it wrong, and even a solid income can vanish by the 25th of the month. This section walks through the frameworks that work, what real 2026 spending data reveals, and how to build a budget sturdy enough to survive real life.
How Budgeting Actually Works
The 50/30/20 Rule and Its Variants
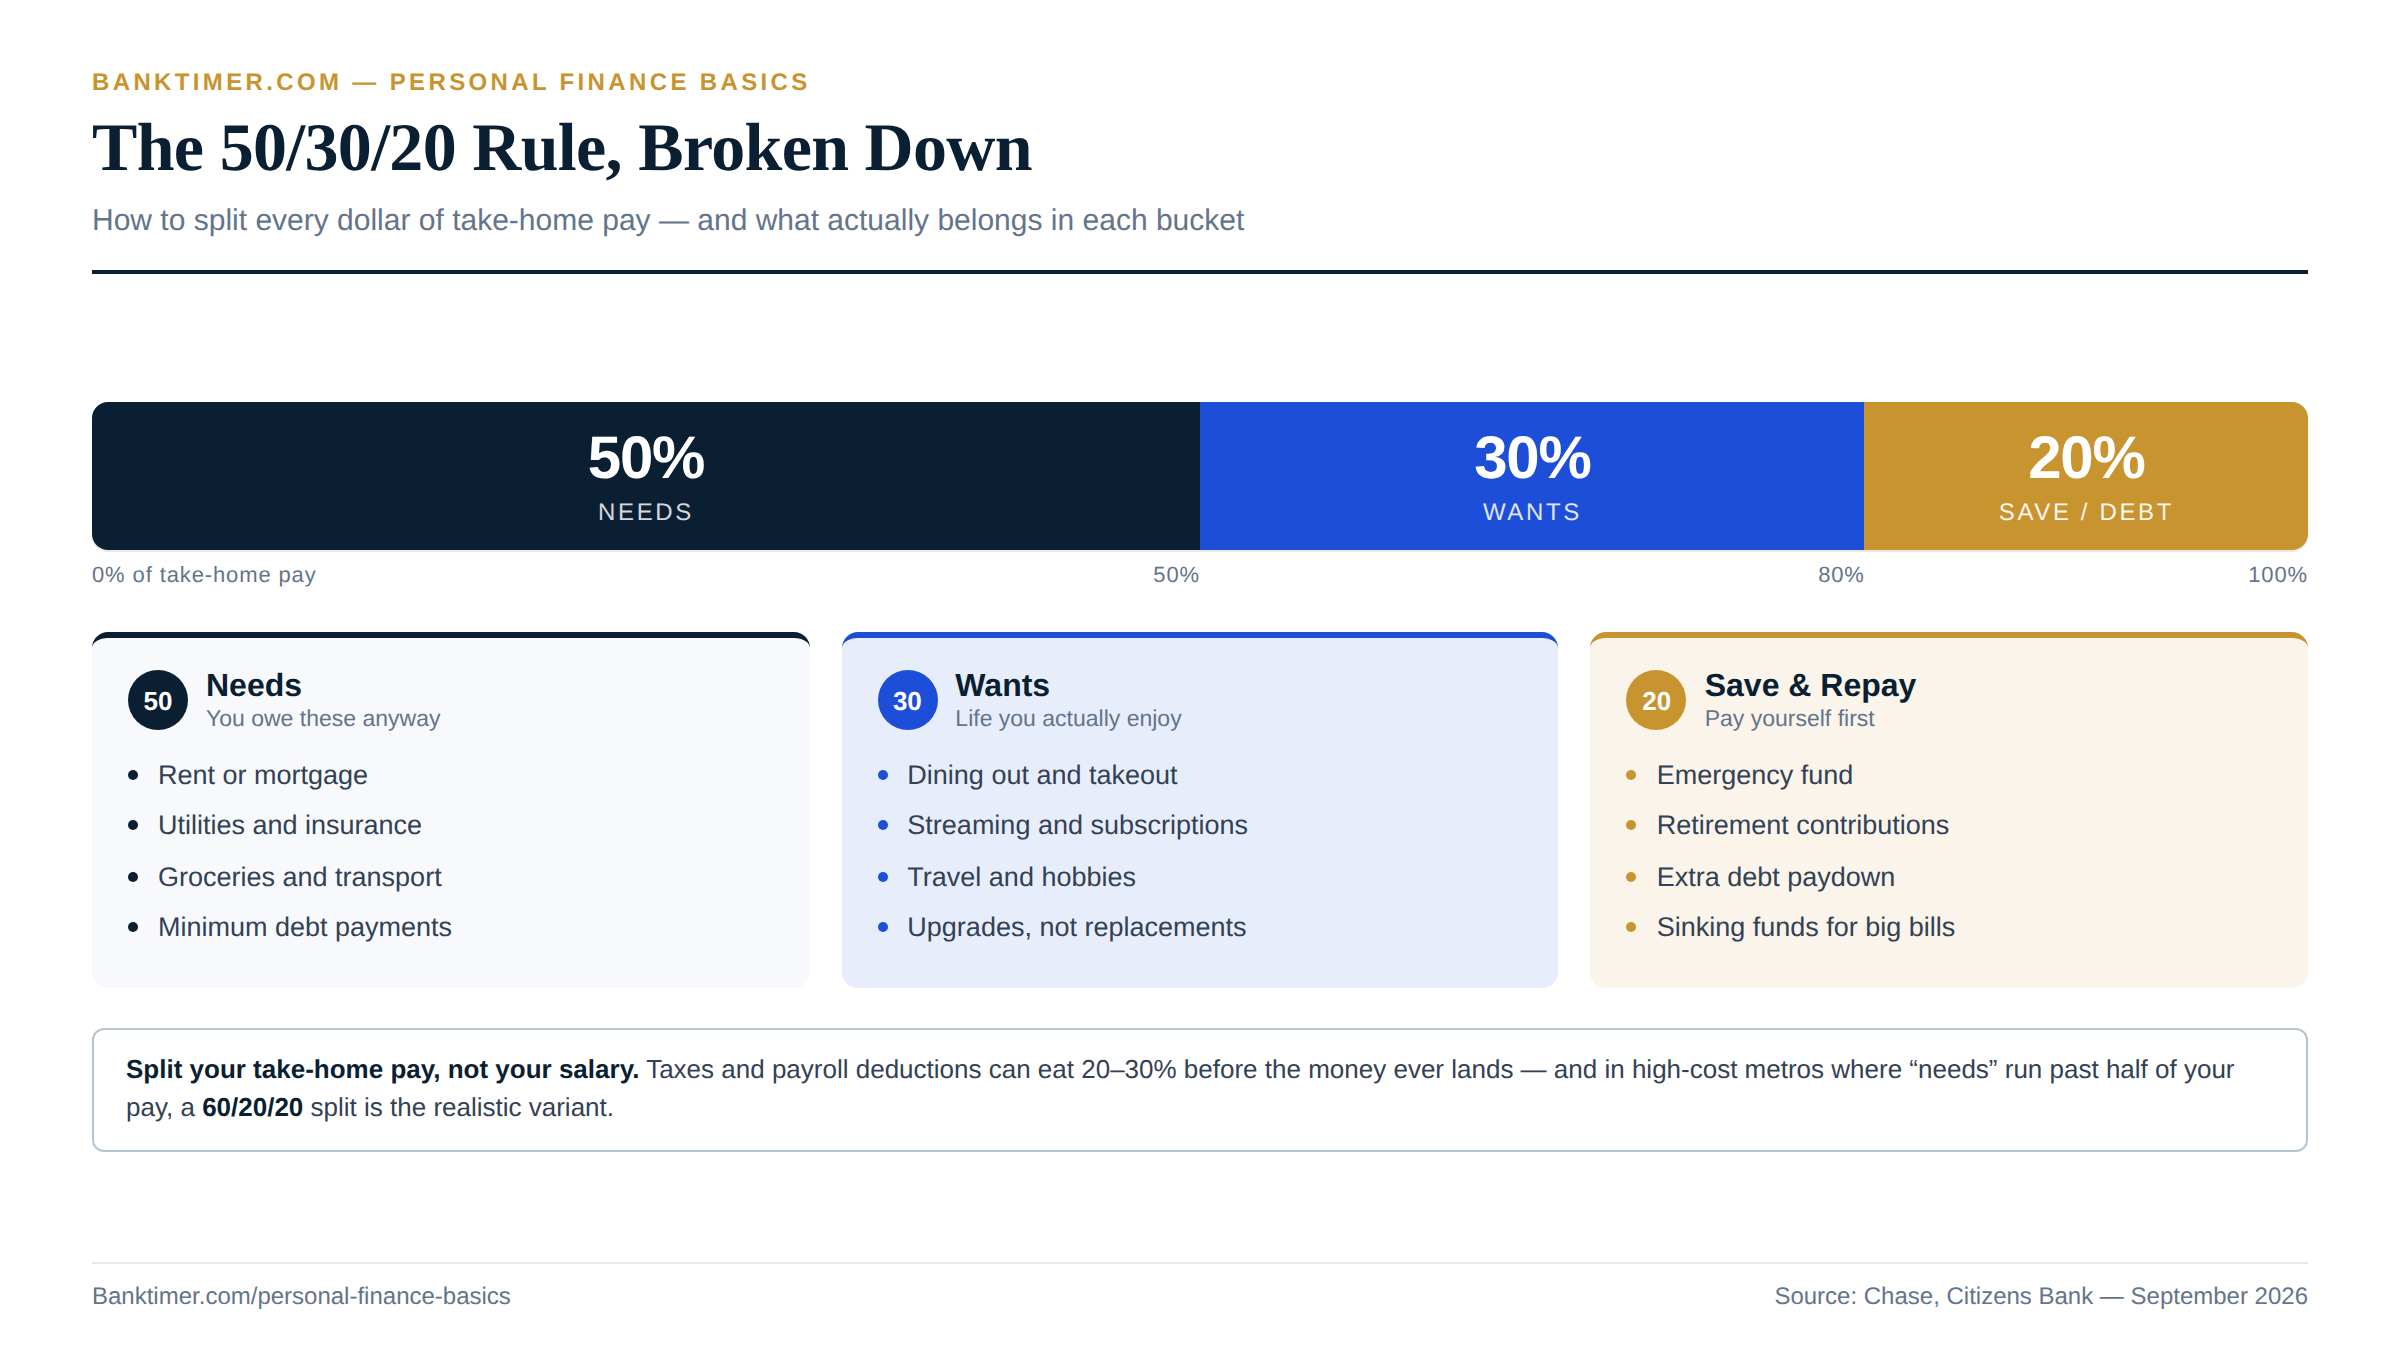
The 50/30/20 rule is still the default starting point for personal finance basics, and it’s easy to see why: it splits your after-tax income into three simple buckets. Harvard bankruptcy professor — and future senator — Elizabeth Warren popularized it in her 2005 book, All Your Worth. Fifty percent covers needs like rent, groceries, and utilities; 30% covers wants; the last 20% funds savings and extra debt payoff.
Chase and Citizens Bank both still teach it as the default framework in 2026, though each notes that in expensive metro areas, needs routinely eat more than half of take-home pay. That’s why some advisors now suggest a 60/20/20 split instead, especially where housing costs run high.
Zero-Based Budgeting and the Envelope Method
Zero-based budgeting takes a stricter approach: every dollar gets a job — spending, saving, or debt payoff — until income minus allocations equals zero. It’s the engine behind apps like YNAB and Dave Ramsey’s EveryDollar, and it demands more monthly upkeep than a percentage rule like 50/30/20.
The envelope method, or “cash stuffing,” works differently: you withdraw cash and divide it into labeled envelopes by category, and once an envelope’s empty, spending stops, according to Experian. It resurged as a social-media trend in the 2020s, but it has real trade-offs. It forces discipline and makes overspending physically impossible, yet it earns zero interest, carries a security risk at home, skips card rewards entirely, and gets awkward fast in a shared household where one partner stuffs envelopes while the other swipes a joint card.
Pay-Yourself-First and Automated Budgeting
Pay-yourself-first flips the usual order. Instead of saving whatever’s left after spending, you automatically move a fixed amount into savings the moment your paycheck lands — before you can spend a dime of it. It’s a small mechanical shift, but it removes willpower from the equation entirely.
Most modern budgeting apps are built around automating exactly this. Once the transfer happens on its own, the money left in checking is already your real spending limit, not a number you have to remember to protect. That single habit is one of the most durable personal finance basics you can build, because it keeps working even during a bad week when you’re too tired to think about money at all.
Choosing the Right Budgeting App in 2026
The app landscape looks different than it did a few years ago. Intuit shut down Mint in January 2024 and pushed its users toward Credit Karma, so Mint is no longer an option at all. In its place, CNBC Select’s 2026 rankings point to several clear leaders for different needs.
Monarch ($8.33/month billed annually) suits people who want net-worth tracking alongside budgeting, while Quicken Simplifi (around $6.99/month after an intro promo) targets planners who want real-time spending plans. YNAB ($14.99/month) is built for serious zero-based budgeters, and Empower offers free budgeting with an optional paid investment-management layer. Goodbudget and Honeydue remain solid free options for beginners and couples. There’s no single “best” app — the right one depends on whether you want structure, simplicity, or shared visibility with a partner.
What the 2026 Numbers Say About How Americans Spend
Average Household Spending by Category
The clearest picture of how Americans actually spend comes from the Bureau of Labor Statistics’ Consumer Expenditure Survey — full-year 2024 data, the most recent available, released in December 2025. The average household spent $78,535 that year, or roughly $6,545 a month.
Housing led everything at 33.4% of the budget, followed by transportation at 17.0% and food at 12.9%. Personal insurance and pensions took another 12.5%, and healthcare claimed 7.9%. Those figures are more than a year old by the time you read them, but they’re still the most reliable baseline for checking your own 2026 budget against — not last year’s guess, and not a number pulled from social media.
Housing and Transportation Eat More Than Half of Every Budget
Here’s the number that matters most for anyone budgeting from scratch: housing and transportation together consumed 50.4% of average household spending in that BLS data — more than every other category combined. That’s not a coincidence; it’s the direct result of a decade of home prices and vehicle costs rising faster than wages.
If your own housing and transportation costs run meaningfully above half your take-home pay, you’re not failing at budgeting — you’re fighting the same structural math most of the country is fighting. That’s one of the more sobering personal finance basics: sometimes the fix isn’t a tighter grocery budget, it’s a cheaper car payment, a roommate, or a shorter commute.
Why Two-Thirds of Americans Live Paycheck to Paycheck
Sixty-seven percent of U.S. adults report living paycheck to paycheck in 2026, according to PYMNTS. What’s striking is who’s included: roughly half of consumers earning $100,000 or more say the same thing. Income alone doesn’t buy stability anymore.
Fixed costs — housing, insurance, childcare — have grown so much since 2020 that they now swallow a larger share of pay no matter how much you earn. That’s exactly why a written budget matters more at every income level, not less. Without one, a six-figure salary and a $45,000 salary can feel equally tight, because both are being outpaced by the same rising fixed costs.
How Inflation Is Quietly Reshaping Every Budget
Inflation doesn’t announce itself; it just makes last year’s numbers wrong. Headline CPI ran 3.4% year-over-year in August 2026, per the Bureau of Labor Statistics, with core inflation at 2.4% — both still above the Fed’s 2% target. That gap matters because a budget built on last year’s grocery bill or gas prices is already stale.
As a result, a static budget quietly loses accuracy every month it isn’t revisited. Instead of setting your budget once and forgetting it, treat it as a living document you check quarterly — the categories that drift fastest, like groceries and insurance, are usually the ones nobody rechecks.
There’s also a debt angle worth watching going into the rest of 2026. Because most credit cards carry variable, prime-linked rates, the Federal Reserve’s September 16 hike to 3.75%–4.00% pushes minimum payments on existing card balances higher almost immediately. If your budget has a credit card line item, revisit it now rather than waiting for the statement to surprise you.
How to Build a Budget That Survives Contact With Real Life
Calculate Your True Take-Home Income First
Every workable budget starts with the same question: what actually lands in your bank account? Not your salary, not your gross pay — your true take-home income after taxes and withholdings, plus any consistent side income. This sounds obvious, but skipping it is one of the most common budgeting errors, and it guarantees your percentages are wrong from day one.
If you budget 50% of gross pay toward needs, you’ll overshoot the moment taxes come out, because that money was never yours to allocate. Pull your last two or three pay stubs, average the take-home figure, and build everything else on top of that real number instead of a hopeful one.
Track a Full Month Before You Set Any Limits
Resist the urge to set category limits on day one. NerdWallet’s guidance and most financial planners agree: track every dollar you actually spend for at least one full month before deciding what your limits should be. Most people badly underestimate variable spending, often by a wide margin, especially in categories like:
- Restaurant delivery and takeout
- Recurring subscriptions and streaming services
- Irregular annual bills, like insurance premiums or holiday gifts
A budget built on guesswork sets you up to blow through categories in week one and abandon the whole plan out of frustration. A budget built on one real month of data reflects your actual life, not the life you assume you’re living.
Separate Fixed Costs From Variable Ones
Fixed costs — rent, car payments, insurance premiums, minimum debt payments — don’t move month to month. Variable costs, like groceries, gas, and entertainment, do. Separating the two matters because your fixed costs are your real financial floor: the amount you owe even in a bad month with zero discretionary spending.
Knowing that number cold is one of the more underrated personal finance basics, because it tells you exactly how much income loss you could absorb before real trouble starts. Without it, a job loss or a reduced-hours month turns into panic instead of a plan, simply because you never established your own baseline.
Automate Savings Before You See the Money
The single most reliable fix for a budget that keeps failing is automating savings the day your paycheck arrives, not the day after bills are paid. Set up a recurring transfer — even a modest one — that moves money into savings before you have a chance to spend it.
This is the pay-yourself-first principle in practice, and it works precisely because it removes discipline from the equation. You can’t accidentally spend money that’s already gone. As a result, even a rocky budgeting month still ends with some progress instead of zero savings and a fresh excuse.
Budgeting Mistakes, Red Flags, and What Changed in 2026
The Overly Restrictive Budget That Gets Abandoned
Across nearly every source on this topic, one failure mode shows up more than any other: a budget so restrictive it gets abandoned within weeks. Cutting every “want” to zero sounds disciplined, but it rarely survives a birthday, a bad week, or a friend’s wedding.
Sustainable budgets build in a small fun-money buffer on purpose, because perfection isn’t the goal — consistency is. That’s one of the harder personal finance basics to accept: a budget you can actually stick to at 90% beats a perfect one you abandon by March.
Budgeting Off Gross Income Instead of Take-Home Pay
This mistake pairs directly with the take-home-income point above, but it’s common enough to call out on its own. Budgeting 50% of your gross salary toward needs, instead of your after-tax pay, means every category is inflated before you’ve spent a cent.
The gap between gross and take-home can easily run 20–30% once taxes, retirement contributions, and health premiums come out — real money your budget assumed you’d have. The fix is simple: always build percentage-based budgets, whether 50/30/20 or a variant, off the number that actually deposits into your checking account.
Subscription Traps Inside Budgeting Apps Themselves
Here’s an irony worth flagging: some budgeting tools now cost enough to undercut the savings they’re supposed to help you find. YNAB runs $109/year, and PocketGuard’s premium tier runs close to $75/year — real recurring costs that quietly join your own subscription list.
Before paying for any app, check whether a free tier like Goodbudget or Empower actually covers what you need, per CNBC Select’s 2026 comparison. Also check auto-renewal terms specifically; annual plans that renew silently are exactly the kind of invisible cost a budgeting app is supposed to catch, not cause.
Why Debt-Relief Ads Multiplied as CFPB Oversight Shrank
Budgeting content has become a magnet for a specific kind of ad: debt-relief and credit-repair companies promising to erase balances for an upfront fee. That’s not a coincidence. Congress cut the CFPB’s statutory funding cap roughly in half in 2025, and the agency’s enforcement bandwidth has shrunk along with it.
Consumer advocates say scammers now face measurably less scrutiny as a result. If a debt-relief pitch shows up inside a budgeting app or article promising guaranteed results for a fee paid upfront, treat it as a red flag rather than a shortcut — reduced federal oversight in 2026 means more of that screening now falls on you.
Compound Interest
Compound interest is one of the first personal finance basics that actually pays you back for learning it. It’s the quiet engine behind every slow-and-steady savings plan. Once you understand how it works, a savings statement — or a credit card bill — looks completely different. Below, we’ll break down the real formula, 2026’s rates, and the habits that keep compounding working for you instead of against you.
How Compound Interest Actually Works
The Formula Behind “Interest on Interest”
Every compounding calculation traces back to one formula: A = P(1 + r/n)^(nt), where A is your final balance, P is your starting principal, r is the annual interest rate, n is how often it compounds each year, and t is the number of years. This is the same formula Investor.gov’s own compound interest calculator uses.
The concept behind it is simple, even if the formula looks intimidating: compound interest pays interest on your principal, plus all the interest you’ve already earned. That’s the entire mechanical difference between compound interest and its plainer cousin, simple interest — and it’s why people call it “interest on interest.”
APY vs. APR, and Why the Difference Matters
You’ll see two rates advertised everywhere: APY (Annual Percentage Yield) and APR (Annual Percentage Rate). APY already factors in compounding frequency, so it reflects what you’ll actually earn over a year. APR doesn’t account for compounding at all.
Savings accounts and CDs almost always advertise APY, because it’s the more flattering — and more accurate — number for a saver. When you compare two accounts, always compare APY to APY: a 4.10% APY compounding daily will out-earn a 4.10% APR compounding annually, even though the headline number looks identical. That gap is one of the more overlooked personal finance basics, and it can quietly cost you money if you don’t check it.
Compounding Frequency: Daily, Monthly, Annually
All else being equal, more frequent compounding wins. Daily compounding beats monthly, monthly beats quarterly, and quarterly beats a single annual calculation. The reason is straightforward: each time interest compounds, it gets added to your balance and starts earning its own interest sooner.
The catch is that the advantage shrinks as rates get lower — the difference between daily and monthly compounding on a 0.38% savings account is a few cents a year, not a few dollars. At today’s higher rates, though, frequency actually matters. Check whether your bank compounds daily, because that single detail changes your real return without changing the advertised rate at all.
Simple Interest vs. Compound Interest, Side by Side
Simple interest only ever pays you on your original principal, no matter how many years pass. Compound interest pays you on your principal and on every dollar of interest you’ve already accumulated. Over a short time horizon, the two look almost identical.
Stretch the timeline out, though, and the gap becomes dramatic — which is exactly what the numbers in the next section show. Understanding this distinction is one of the personal finance basics that separates people who save passively from people who let their money do real work.
What Compound Interest Looks Like in Real Numbers
A Worked Example: $10,000 Over Ten Years
Let’s put real numbers behind the formula. Say you drop $10,000 into a top-tier high-yield savings account paying 4.21% APY — the rate Axos Bank was offering as of September 2026, per NerdWallet’s rate roundup — and you never touch it again.
After ten years of compounding, that $10,000 grows to roughly $15,105. That’s about $5,105 in pure interest, and you didn’t add a single additional dollar. This is compound interest working exactly as advertised: your money earns money, and then that money earns money too.
Simple vs. Compound Over Twenty Years
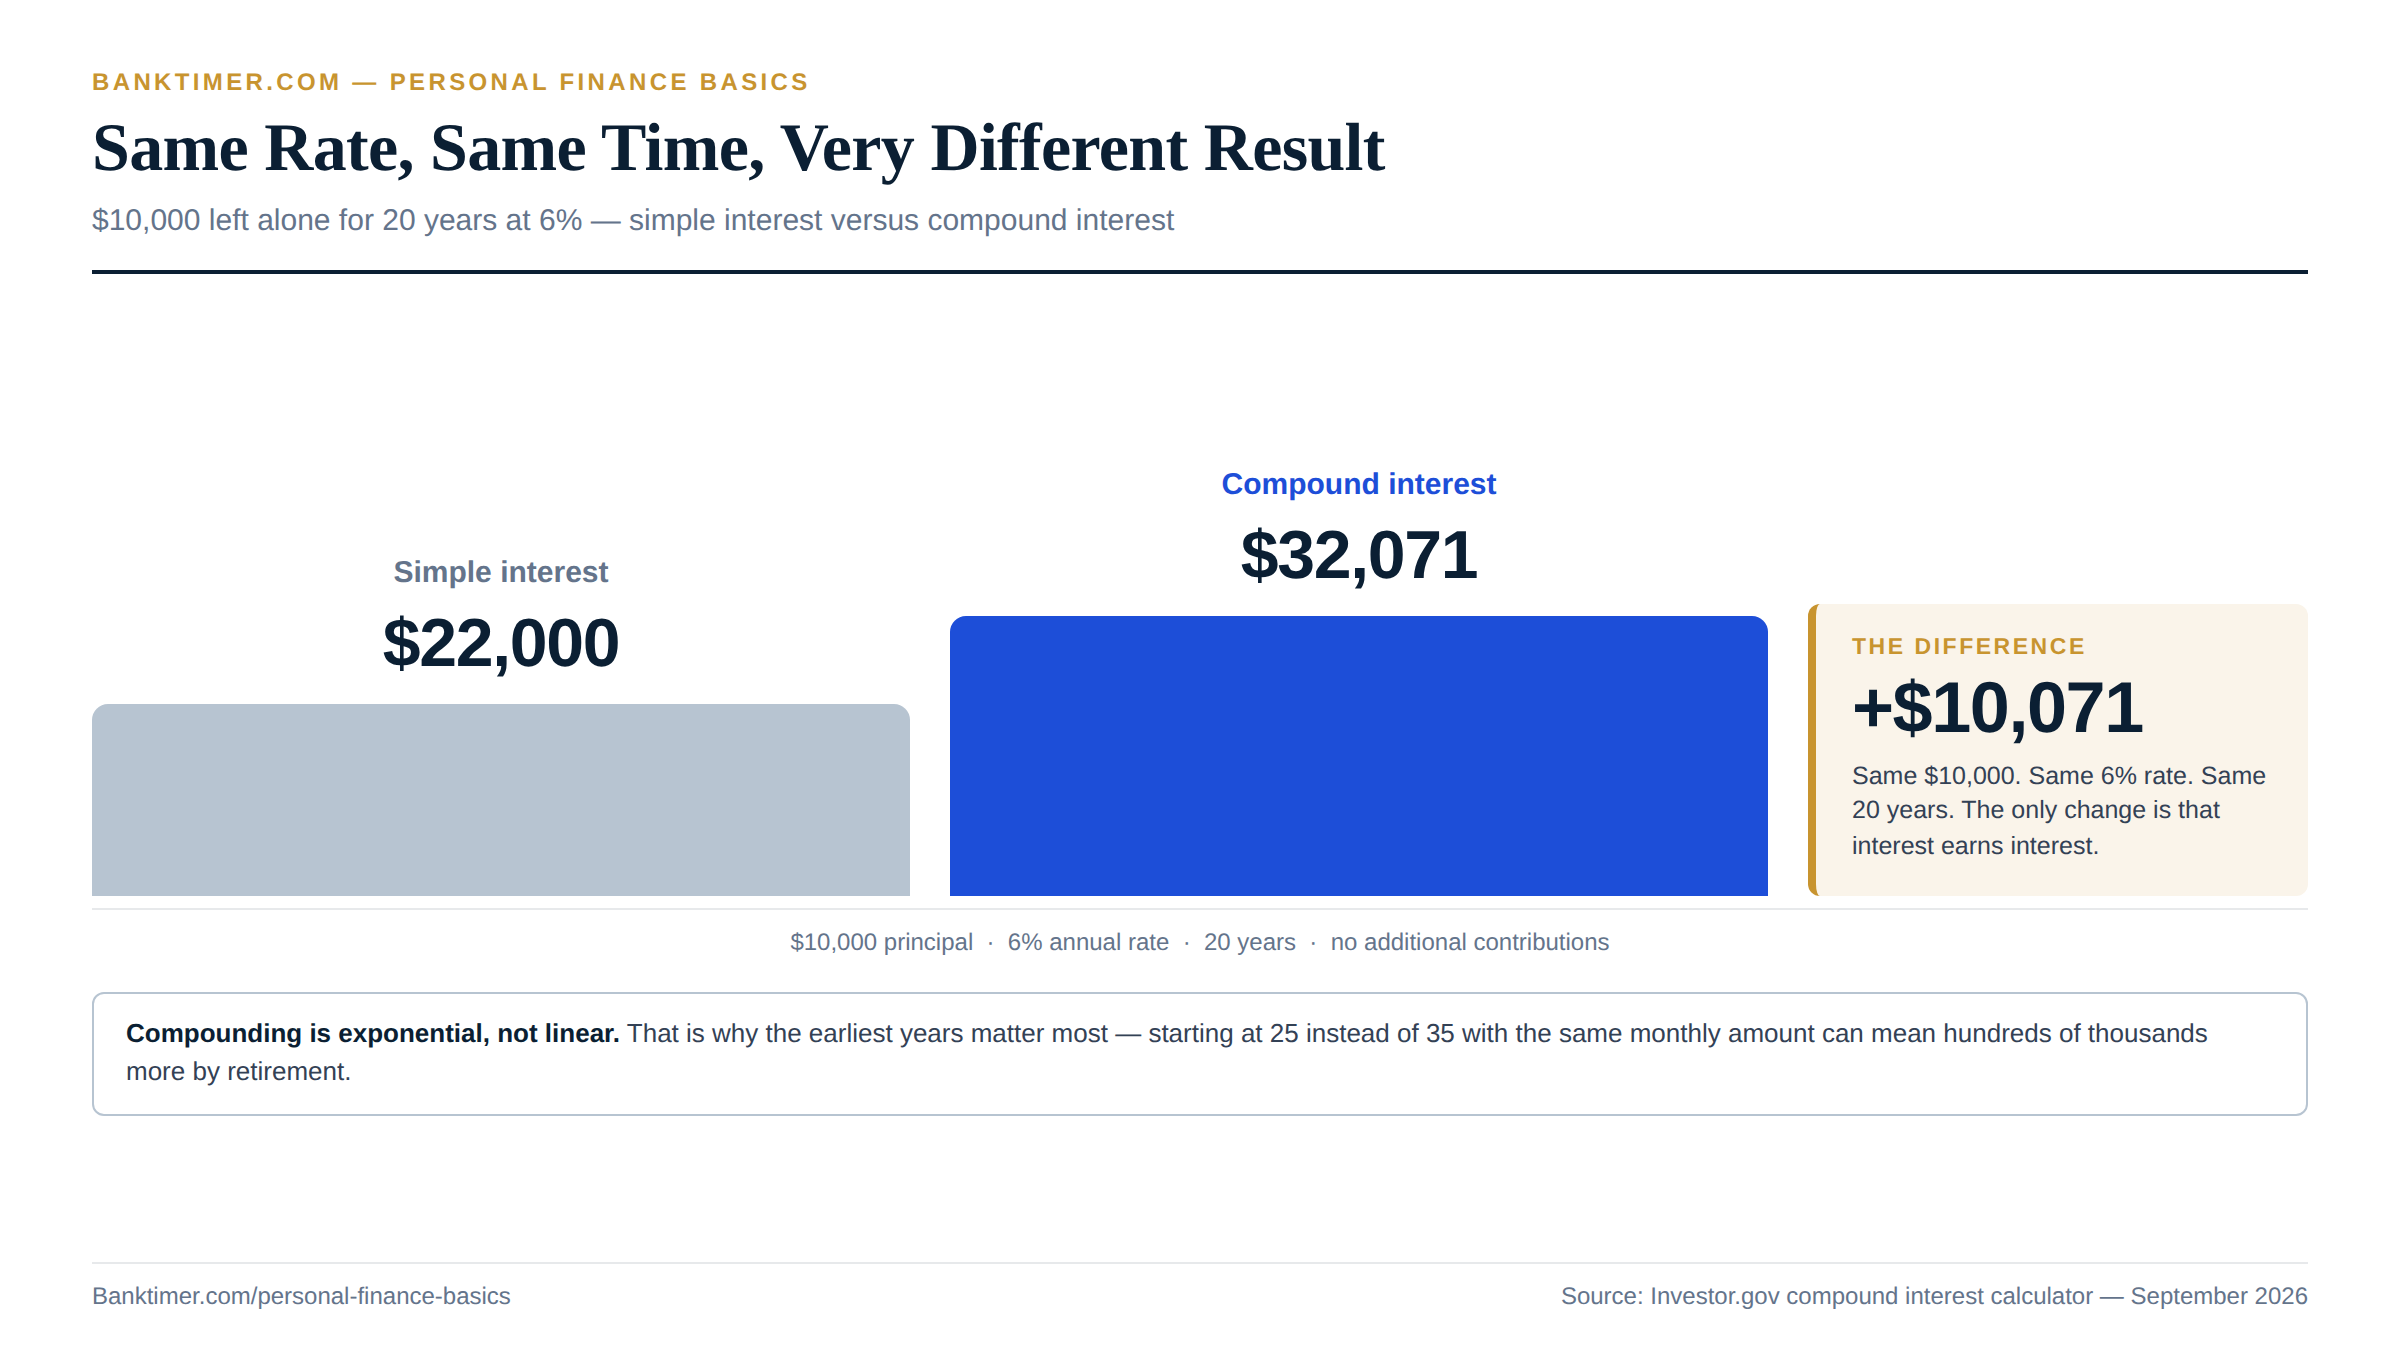
Now compare simple and compound interest directly, using the same $10,000 at a 6% rate over 20 years. Under simple interest, you’d end with $22,000 — just $10,000 plus 6% of the principal for each of the 20 years.
Under compound interest, that same $10,000 grows to roughly $32,071. Compounding alone adds about $10,071 more than simple interest would, on the exact same rate and the exact same principal. Nothing changed except how the interest itself got treated — and that one difference is worth ten thousand dollars.
Dollar-Cost Averaging Into the Market Over Decades
Compounding gets even more powerful once you add regular contributions. Investing $500 a month for 30 years at a 10% average annual return — roughly the S&P 500’s long-run historical average, according to Fidelity — grows to about $1,130,000. You’d have contributed $180,000 of your own money over those three decades; the other roughly $950,000 came purely from growth.
If $500 a month feels out of reach, smaller numbers still compound meaningfully: $200 a month for 20 years at a 7% real return builds to about $104,178, with only $48,000 of that from your own contributions.
The 10% figure isn’t fixed, though — it’s a long-run average that hides real variance. Fidelity’s own data shows the S&P 500 averaged 14.8% annually over the trailing 10 years (2016–2025), 11% over the trailing 20 years, and 10.4% over the trailing 30 years. Plugging a more conservative number into your own projections, rather than assuming the best decade repeats, keeps your plan realistic.
Why 2026’s Higher Rates Make Compounding More Valuable
Rates matter more than most savers realize, and 2026 has handed savers a genuinely better deal. On September 16, 2026, the Federal Reserve raised its target rate to 3.75%–4.00% — its first hike in about three years, decided in a unanimous 12-0 vote.
That’s part of why top savings and CD rates sit well above where they were a few years ago. The national average savings account still pays a meager 0.38% APY, but top accounts pay 4%-plus — roughly eleven times more. One-year CDs are paying up to 4.35%, and three- and five-year CDs up to 4.50%, according to Bankrate’s September 2026 survey. For anyone parking cash for the long haul, that gap is real money.
Series I Savings Bonds add another compounding option worth knowing about. Bonds issued between May and October 2026 carry a composite rate of 4.26%, built from a 0.90% fixed rate plus a 1.67% inflation adjustment that resets every six months, according to TreasuryDirect. Coverage from TIPSWatch suggests the fixed-rate portion could climb further at the next reset on November 1, 2026 — useful context if you’re weighing I Bonds against a CD for inflation-protected compounding.
How to Put Compound Interest to Work for You
Start as Early as Possible, Even With Small Amounts
Because compounding is exponential, not linear, the earliest years you invest matter disproportionately more than the years right before retirement. Starting at 25 instead of 35, contributing the same monthly amount, can mean a difference of hundreds of thousands of dollars by retirement — purely from that extra decade of growth.
This is arguably the single most important of all the personal finance basics: time in the market beats timing the market. No amount of stock-picking skill makes up for a decade you didn’t spend invested. Small, early, and consistent beats large, late, and occasional almost every time.
Reinvest Interest and Dividends Automatically
Inside a brokerage or retirement account, automatic dividend reinvestment (often called DRIP) is what actually produces “interest on interest” in stock and fund investing — not just in savings accounts. Every dividend buys a few more shares, which then earn their own dividends.
Robo-advisors like Betterment, Wealthfront, and Schwab Intelligent Portfolios handle this automatically, offering a low-effort entry point for beginners who don’t want to pick individual funds. Traditional financial advisors charging around 1% of assets annually are a common alternative, but that fee compounds against you over decades — so cost matters nearly as much as returns do.
Choose Accounts That Compound Daily
Not all savings accounts are created equal, and the account you pick changes your outcome even at the same headline rate. As of September 2026, NerdWallet’s rate survey had Axos Bank at 4.21% APY, CIT Bank’s Platinum Savings up to 4.10%, and Climate First Bank and Peak Bank both around 4.01%.
Look for daily compounding specifically, and confirm your money is protected — FDIC insurance covers up to $250,000 per depositor, per bank, per ownership category, with NCUA providing equivalent coverage at credit unions. A high rate means little without that safety net underneath it.
Avoid Interrupting the Compounding Timeline
Every withdrawal resets part of the clock, because the money you pull out stops earning its own interest. That’s why the healthiest habit is treating contributions as automatic and untouchable.
It’s also why capturing your full employer 401(k) match, covered in the next section, should come before other saving goals — it’s an immediate, guaranteed return that no market investment can promise. The fewer times you interrupt the compounding timeline, whether by withdrawing early or skipping months, the more of this exponential effect you actually keep.
Compound Interest Mistakes and Misconceptions
Underestimating How Much Time Matters More Than Rate
A handy shortcut called the Rule of 72 estimates how long money takes to double: divide 72 by your interest rate. At 8%, your money doubles in about nine years — a rule of thumb cited by sources ranging from the Nebraska Department of Banking and Finance to countless credit-union education pages.
The mistake most people make is assuming a slightly higher rate matters more than starting sooner. It usually doesn’t. Delaying contributions by even five to ten years can cut your total retirement compounding by more than half, even if you eventually save more per month trying to catch up.
Compound Interest Working Against You in Debt
Compounding doesn’t care whether it’s working for you or against you — and credit card debt is where it turns hostile. The average credit card APR sat at 24.96% as of September 14, 2026, according to Forbes Advisor’s tracking of 250-plus cards; the Federal Reserve’s broader measure put it at 22.15% back in May.
That’s a form of negative compounding: every month you carry a balance, you owe interest on last month’s interest too. No diversified investment reliably clears a guaranteed 22–25% cost, which is why paying off high-interest debt almost always beats investing while it’s outstanding.
Chasing a Slightly Higher Rate at the Cost of Consistency
Comparison shopping for the best APY is smart, but it can become a distraction. Moving $20,000 out of a checking account paying near-zero into any top HYSA is worth roughly $700-plus a year, and that jump matters far more than the difference between two competing 4%-plus offers.
Some savers spend hours chasing an extra tenth of a percentage point and end up delaying the deposit, or skipping a month’s contribution while they “decide.” Consistency beats optimization here. Pick a solid, FDIC-insured account today, and automate your contributions — you can always shop rates again later without losing momentum.
Misreading APY Teaser Rates and Promotional Periods
Online banks frequently advertise a headline APY that only applies under specific conditions, like a promotional window, a minimum balance, or a direct-deposit requirement. Many “new customer” rates quietly drop after three to six months, and top-of-list rates often come with conditions attached.
Before you move money, read the fine print: what’s the ongoing rate after the promotion ends, and what balance tier actually earns the top APY? Treating an introductory teaser rate as your permanent return is one of the more common compound interest mistakes, and it’s an easy one to avoid with five minutes of reading.
A more dangerous version of this same mistake is mistaking fraud for a great rate. Investor.gov warns that any offer promising unusually high, “guaranteed,” or “risk-free” returns — especially ones marketed as compounding daily or weekly — is a classic Ponzi or high-yield-investment-program red flag. Legitimate accounts never guarantee a return above what the broader market or FDIC-insured rates are paying, so treat urgency, secrecy, or an unregistered seller as a reason to walk away, not a reason to move faster.
Cost of Living
Cost of living is where personal finance basics meet the real world. The same salary can feel generous in Tulsa and tight in Boston. No budget survives contact with a move you didn’t price out first. Understanding how cost of living is measured matters. So does knowing what it looks like in 2026, and how to calculate your own number. It’s one of the most useful personal finance basics around — get it wrong, and a raise can quietly turn into a pay cut.
How Cost of Living Is Actually Measured
CPI vs. a Cost-of-Living Index, Explained Simply
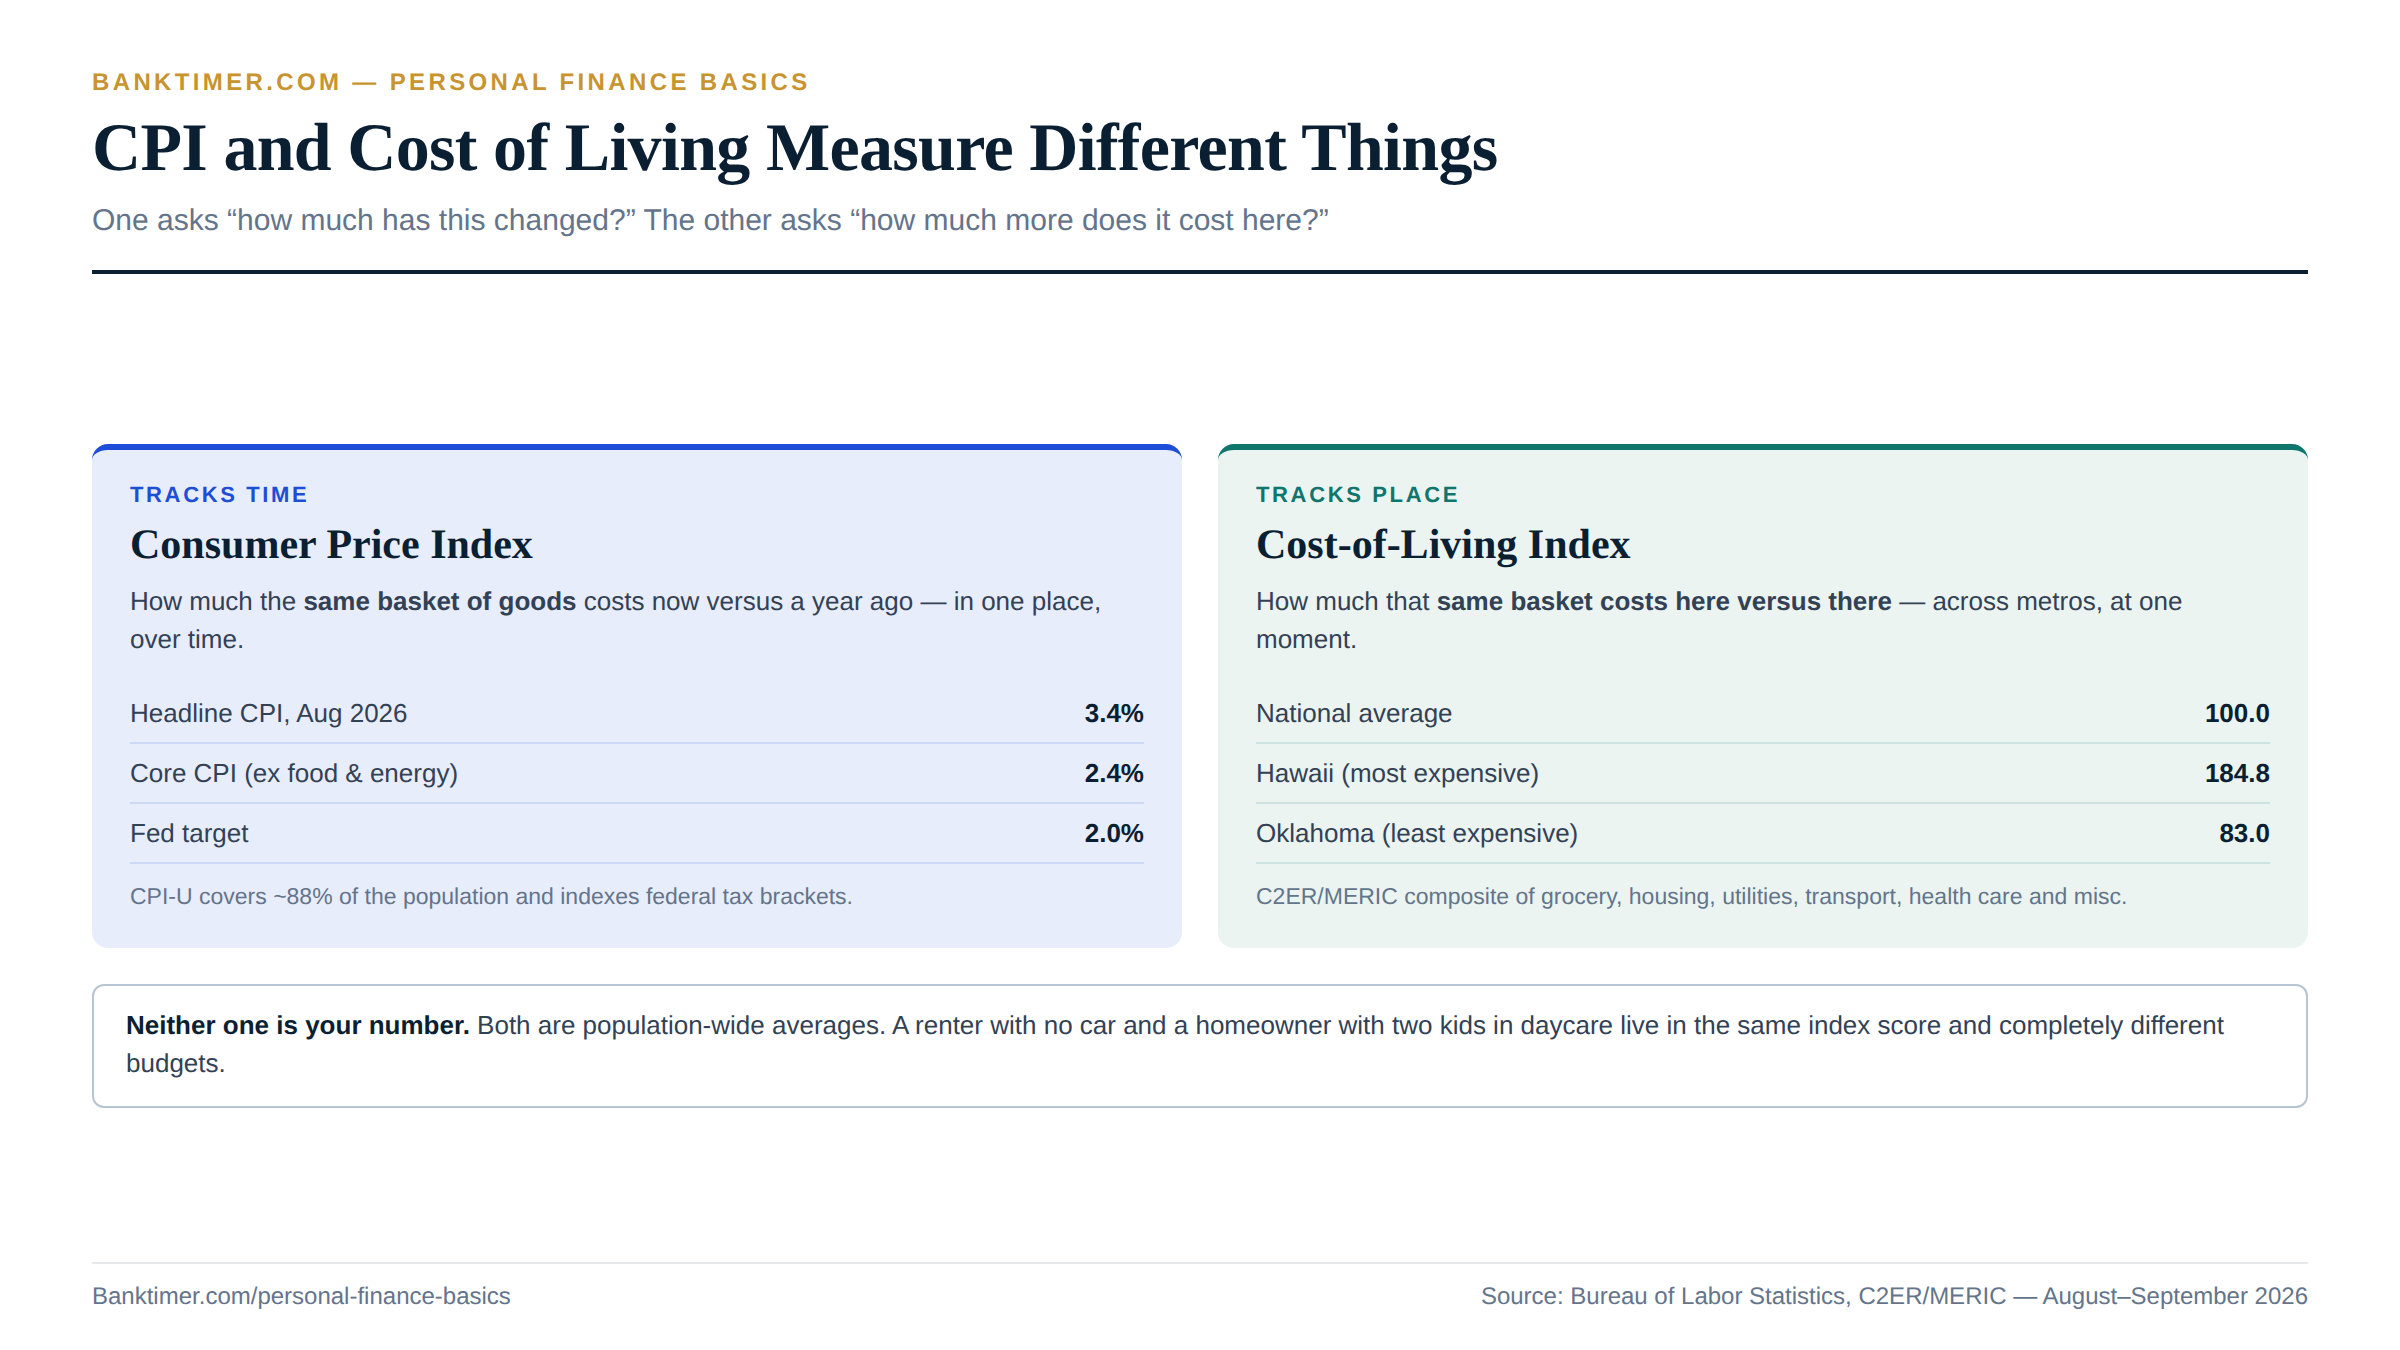
People use “inflation” and “cost of living” interchangeably. They actually measure different things. CPI tracks how prices for a fixed basket of goods change over time, in the same place. A cost-of-living index compares that same basket between different places, at one moment in time.
Neither one tells you your personal number. Both are population-wide averages built from a standardized basket, according to the Wikipedia overview of cost-of-living index theory. CPI itself splits into two versions. CPI-U covers about 88% of the population and is the headline number. CPI-W covers a narrower 28% and drives Social Security COLAs. The Bureau of Labor Statistics traces that split to a 1974 political compromise.
CPI-U is the number in every monthly headline. It’s also what the IRS uses to index federal tax brackets each year. So when people say “inflation is 3.4%,” they almost always mean CPI-U, not the cost-of-living index used for city comparisons.
How Regional Cost-of-Living Indices Are Built
The most widely cited U.S. tool is the C2ER Cost of Living Index (COLI), compiled quarterly by the Missouri Economic Research and Information Center. It combines six categories into one composite score: grocery, housing, utilities, transportation, health care, and miscellaneous goods and services.
The national average is always set to 100. A metro scoring 120 costs 20% more than average. One scoring 80 costs 20% less. MERIC draws from roughly 270 to 300 participating urban areas each quarter, each submitting standardized local pricing data.
Numbeo works differently. It relies on crowdsourced, self-reported prices with no standardized survey design. It advertises nearly 9.9 million prices across more than 12,800 cities, from almost 888,000 contributors. Sample sizes per city vary enormously, though. Treat it as a directional sanity check, not a precise benchmark for a real financial decision.
What Counts Toward Your Personal Cost of Living
Your real cost of living isn’t a single published number. It’s your housing, food, taxes, transportation, and health care costs, added together, in your specific zip code. That’s a different question than “how much does a comparable basket cost nationally?”
This is one of the personal finance basics that trips people up. They check a city’s COLI score and assume it describes their household. It doesn’t. A renter with no car and no kids experiences a metro completely differently than a homeowner does. Picture that same homeowner commuting with two kids in daycare — same composite score, totally different reality.
The same six categories build a regional index: grocery, housing, utilities, transportation, health care, and miscellaneous goods. They’re also the right starting checklist for your own number. A published index weights them by population averages; your real cost of living should weight them by how you actually spend.
Why National Averages Can Mislead You
Housing does almost all the work in most cost-of-living headlines. In Q1 2026 data, the housing sub-index alone ranged from 66.9 in Oklahoma to 302.4 in Hawaii — a 4.5x spread. Overall composite scores, by comparison, varied only about 2.2x, per Visual Capitalist’s analysis of MERIC data.
In other words, “expensive state” usually means “expensive housing,” not uniformly expensive everything. Groceries, utilities, and health care often sit much closer to parity between high- and low-cost states. Fixating on the composite number instead of its housing component is a common, avoidable mistake.
Missouri’s own Q2 2026 numbers make the point on a smaller scale. Its statewide composite is 88.2. Grocery sits at 95.3 and health care at 95.4, both close to the national baseline. Housing, though, sits far lower, at 77.7. The state’s low overall score is really a low housing score wearing a composite number’s clothes.
What Cost of Living Looks Like in 2026
The Latest Inflation Numbers
National CPI-U rose 3.4% year-over-year in August 2026. Core CPI, which strips out food and energy, ran at 2.4%, according to the Bureau of Labor Statistics. That’s the temporal backdrop behind every spatial cost-of-living comparison right now.
Inflation has been unusually uneven by category this year. A national average tells you very little about your own trajectory. A renter and a homeowner with a fixed-rate mortgage are living through genuinely different years, even under the same headline number.
The path here wasn’t smooth, either. CPI-U sat at 2.4% in both January and February 2026, then climbed to 3.3% in March and 3.8% in April. May brought a 4.2% peak — the highest reading since April 2023 — before easing back to 3.4% by August. That swing is the real story underneath every cost-of-living comparison this year.
Where Costs Have Risen Fastest
Energy prices jumped 16.3% year-over-year in August 2026. Airline fares climbed even faster, up 23.4%, per BLS data. Shelter costs rose a comparatively modest 3.0% nationally. Rent is more mixed: national median asking rent hit $1,390 in August 2026, actually down 0.8% year-over-year, according to Apartment List.
That national rent figure hides sharp regional splits. Sun Belt metros like Austin, Phoenix, and San Antonio are still soft from overbuilding. Bay Area rents, meanwhile, are climbing again, driven largely by AI-industry hiring. Averages flatten stories that are actually quite different city to city.
Housing affordability may also be turning a corner structurally. Redfin’s late-2025 forecast anticipated wage growth outpacing home-price growth in 2026, for the first time since the financial crisis. Monthly housing payments were projected to grow more slowly than paychecks — a meaningfully different dynamic than the 2021–2024 stretch.
How Regional Costs Compare Right Now
The most and least expensive states haven’t shuffled much in 2026. Per C2ER/MERIC data for Q1 and Q2 2026:
- Most expensive: Hawaii (184.8–185.8), Massachusetts (147.8), California (140.5), Washington D.C. (134.3), Alaska (129.0)
- Least expensive: Oklahoma (83.0–83.5), Alabama (85.0), Mississippi (86.2), Kansas (87.6), West Virginia (87.9)
Missouri’s Q2 2026 breakdown shows how to read one of these scores. The overall composite is 88.2, with housing at just 77.7 but health care closer to average, at 95.4. A single “affordable state” number still hides category-by-category variation worth checking. Even within Missouri, cities vary: Joplin came in lowest at 83.8, Springfield highest at 91.6. Every Missouri metro still landed below the national baseline.
The broader regional pattern has held steady all year. The most expensive areas cluster in Hawaii, Alaska, the Northeast, and the West Coast. The least expensive cluster in the Midwest and South, per MERIC’s own data. That geography rarely shifts quickly. It’s a reasonably stable starting point, even as exact index numbers move quarter to quarter.
The Data Lag Nobody Tells You About
Every cost-of-living tool is looking slightly backward. The BLS Consumer Expenditure Survey’s full-year data lags by about a year — the most recent finalized figures are for 2024, released in December 2025. COLI updates quarterly, which is faster, but it still trails real-time prices.
That lag matters more in a volatile year. CPI ranged from 2.4% in February 2026 to a 4.2% peak in May before settling near 3.4%. A cost-of-living comparison built on six-month-old data may already understate what a move would actually cost you today.
The rental market shows this kind of shift happening in real time. Apartment List’s August 2026 report found seven straight months of positive month-over-month rent growth. It also found the first vacancy-rate decline since late 2021. The year-over-year rent figure is still slightly negative, though. A comparison tool that hasn’t been refreshed recently could easily miss that this market is turning.
How to Calculate Your Real Cost of Living
Total Your Actual Fixed and Variable Costs
Start with fixed monthly costs: rent or mortgage, property tax, insurance, loan minimums, utilities, and subscriptions. Then add variable-but-recurring costs — groceries, gas, routine medical, personal care. Use a three-month average from actual bank and card statements, not a guess.
Finally, annualize the irregular expenses: car registration, holiday spending, annual insurance premiums, home and vehicle maintenance. Divide that total by twelve. That way it’s baked into your monthly number instead of ambushing you once a year. This is one of those personal finance basics that feels tedious once and pays off for years afterward.
Don’t stop at gross numbers. Add back what’s actually withheld for federal, state, and FICA taxes. That shows you the real gap between a salary figure and what you truly have to work with each month. Skipping this step is exactly how two similar-looking job offers end up feeling nothing alike once the paychecks arrive.
Benchmark Against Regional, Not National, Averages
Once you have your real numbers, compare your category totals against BLS Consumer Expenditure Survey averages. That shows which categories run hot relative to a typical household. Then check your specific metro against the national baseline of 100 using C2ER’s public tables.
Adjust, don’t just compare. If your metro’s housing sub-index is 140 — 40% above average — a goal of “spend the national dollar average on housing” is unrealistic. Benchmark against regional peers instead. Treat Numbeo-style crowdsourced comparisons as a supplementary sanity check, not your primary source.
Adjust for Household Size and Life Stage
A single person’s real cost of living looks nothing like a family of four’s, even in the identical zip code. Childcare alone can add over $13,000 a year nationally, and considerably more in expensive metros. That’s a life-stage cost that simply doesn’t exist in another household’s budget.
It’s tempting to compare your finances to a friend’s or a stranger’s online. That’s one of the least useful personal finance basics people cling to — your own regional and household-size benchmarks matter far more. Recalculate whenever your household composition changes, not just when prices do.
Childcare costs also fall as kids get older. Toddler care runs roughly 85% of the infant rate, and school-age care around 70%. A family’s real cost of living can drop meaningfully within a few years, even if nothing else about their situation changes. Building that trajectory into a multi-year plan beats reacting to it year by year.
Revisit It Before You Relocate
Before any move, rerun the full calculation using current data. Cross-check C2ER/MERIC’s composite score for your target metro. Remember it doesn’t include taxes — you’ll need to research state and local income, sales, and property tax rates separately.
Mortgage-rate context matters too. The 30-year fixed rate averaged 6.6% in 2025, with Redfin projecting roughly 6.3% for 2026. That forecast, though, predates the Federal Reserve’s September 16, 2026 rate hike, which could push borrowing costs back up. Recheck financing costs, not just the cost-of-living score, before you sign anything.
Cost-of-Living Mistakes and What Changed in 2026
Comparing Salaries Without Adjusting for Location
The most common mistake is evaluating a job offer’s raw dollar figure without adjusting for where it’s spent. A 15% raise in a metro with a 40-point-higher housing index can leave you with less real spending power than you had before.
Run any offer through your regional cost-of-living math before accepting it. A number that looks bigger on paper isn’t automatically bigger in practice. It’s one of the personal finance basics that’s easy to say and surprisingly easy to forget under offer-letter excitement.
Ignoring Taxes When Comparing Cities or States
Cost-of-living indices measure prices, not tax burdens. Two states can have nearly identical COLI scores and wildly different total tax bills, once you account for state income tax, sales tax, and property tax rates.
Always research state and local taxes as a separate line item from any cost-of-living comparison. Skip this step, and you risk a nasty surprise at your first paycheck in a new state — even after doing seemingly careful research beforehand.
Rent and Relocation Scams to Watch For
Relocation searches are prime scam territory. The Federal Trade Commission flags several red flags: listings copied from real ones with swapped contact info, prices suspiciously low for the area, pressure to decide immediately, and demands for wire transfers, gift cards, or cryptocurrency.
Other warning signs include requests for your Social Security number or pay stubs before you’ve even signed a lease. Watch for “owners” who claim to be out of the country and unable to show a unit in person.
The FTC’s own data shows $65 million in reported rental-scam losses through late 2025. Local coverage from September 2026 confirms these scams remain active right now. Before wiring anyone a deposit, run a quick checklist:
- Reverse-search the property address and the owner’s name, including the word “scam.”
- Insist on viewing the unit in person, or through a trusted local contact.
- Contact the owner only through verified, official channels — never the number in the ad alone.
- Withhold personal documents until a lease is actually signed.
If something feels off, report it to the hosting website, the FTC, or your state attorney general.
How Tariffs and Energy Prices Are Feeding Through
Two under-discussed forces are quietly reshaping 2026 cost-of-living comparisons. Tariff pass-through was delayed through 2025, then turned “markedly positive” by mid-2026, per the Minneapolis Fed. Clothing and footwear inflation jumped from 0.3% to 3.5% year-over-year in that stretch.
Energy, not tariffs, has actually been the bigger driver of above-target inflation since March 2026. And the Federal Reserve’s September 16 hike to 3.75%–4.00% raises borrowing costs on mortgages and auto loans at the margin. That could push 2026’s real housing costs above earlier, pre-hike forecasts.
Effective tariff rates themselves have been on a rollercoaster. They peaked around 11% in late 2025. By May 2026, they’d fallen to just below 7%, after a February 2026 Supreme Court ruling, according to St. Louis Fed research. If you’re comparing cost-of-living data from different points in 2026, remember: the tariff backdrop itself has shifted underneath those numbers.
Debt
Debt touches nearly every other money decision you’ll make, from the mortgage rate you lock in to the emergency fund you build (or don’t). Get the mechanics wrong, and even a solid income can leave you treading water. That’s the core of personal finance basics: understanding how debt actually works before you decide how to attack it. This section walks through the mechanics, the 2026 numbers, a practical payoff plan, and the scams that thrive on people who skip that first step.
The Debt Mechanics Everyone Should Know
Good Debt vs. Bad Debt
Not all borrowing is created equal, and that distinction is one of the first personal finance basics worth learning. Debt counts as good debt when it builds your net worth, generates income, or funds something with real long-term value — think mortgages, reasonably priced student loans tied to real earning power, or a small-business loan backed by an actual plan.
Bad debt is the opposite: it finances things that lose value or get consumed, usually at a punishing rate. Credit cards often run 20-22% APR nationally in 2026, and payday loans frequently top 400% APR — industry commentary calls them 10 to 15 times worse than a credit card. Auto loans sit in a gray zone: necessary for most people, but a new car can lose roughly 20% of its value in year one alone.
Debt Avalanche vs. Debt Snowball
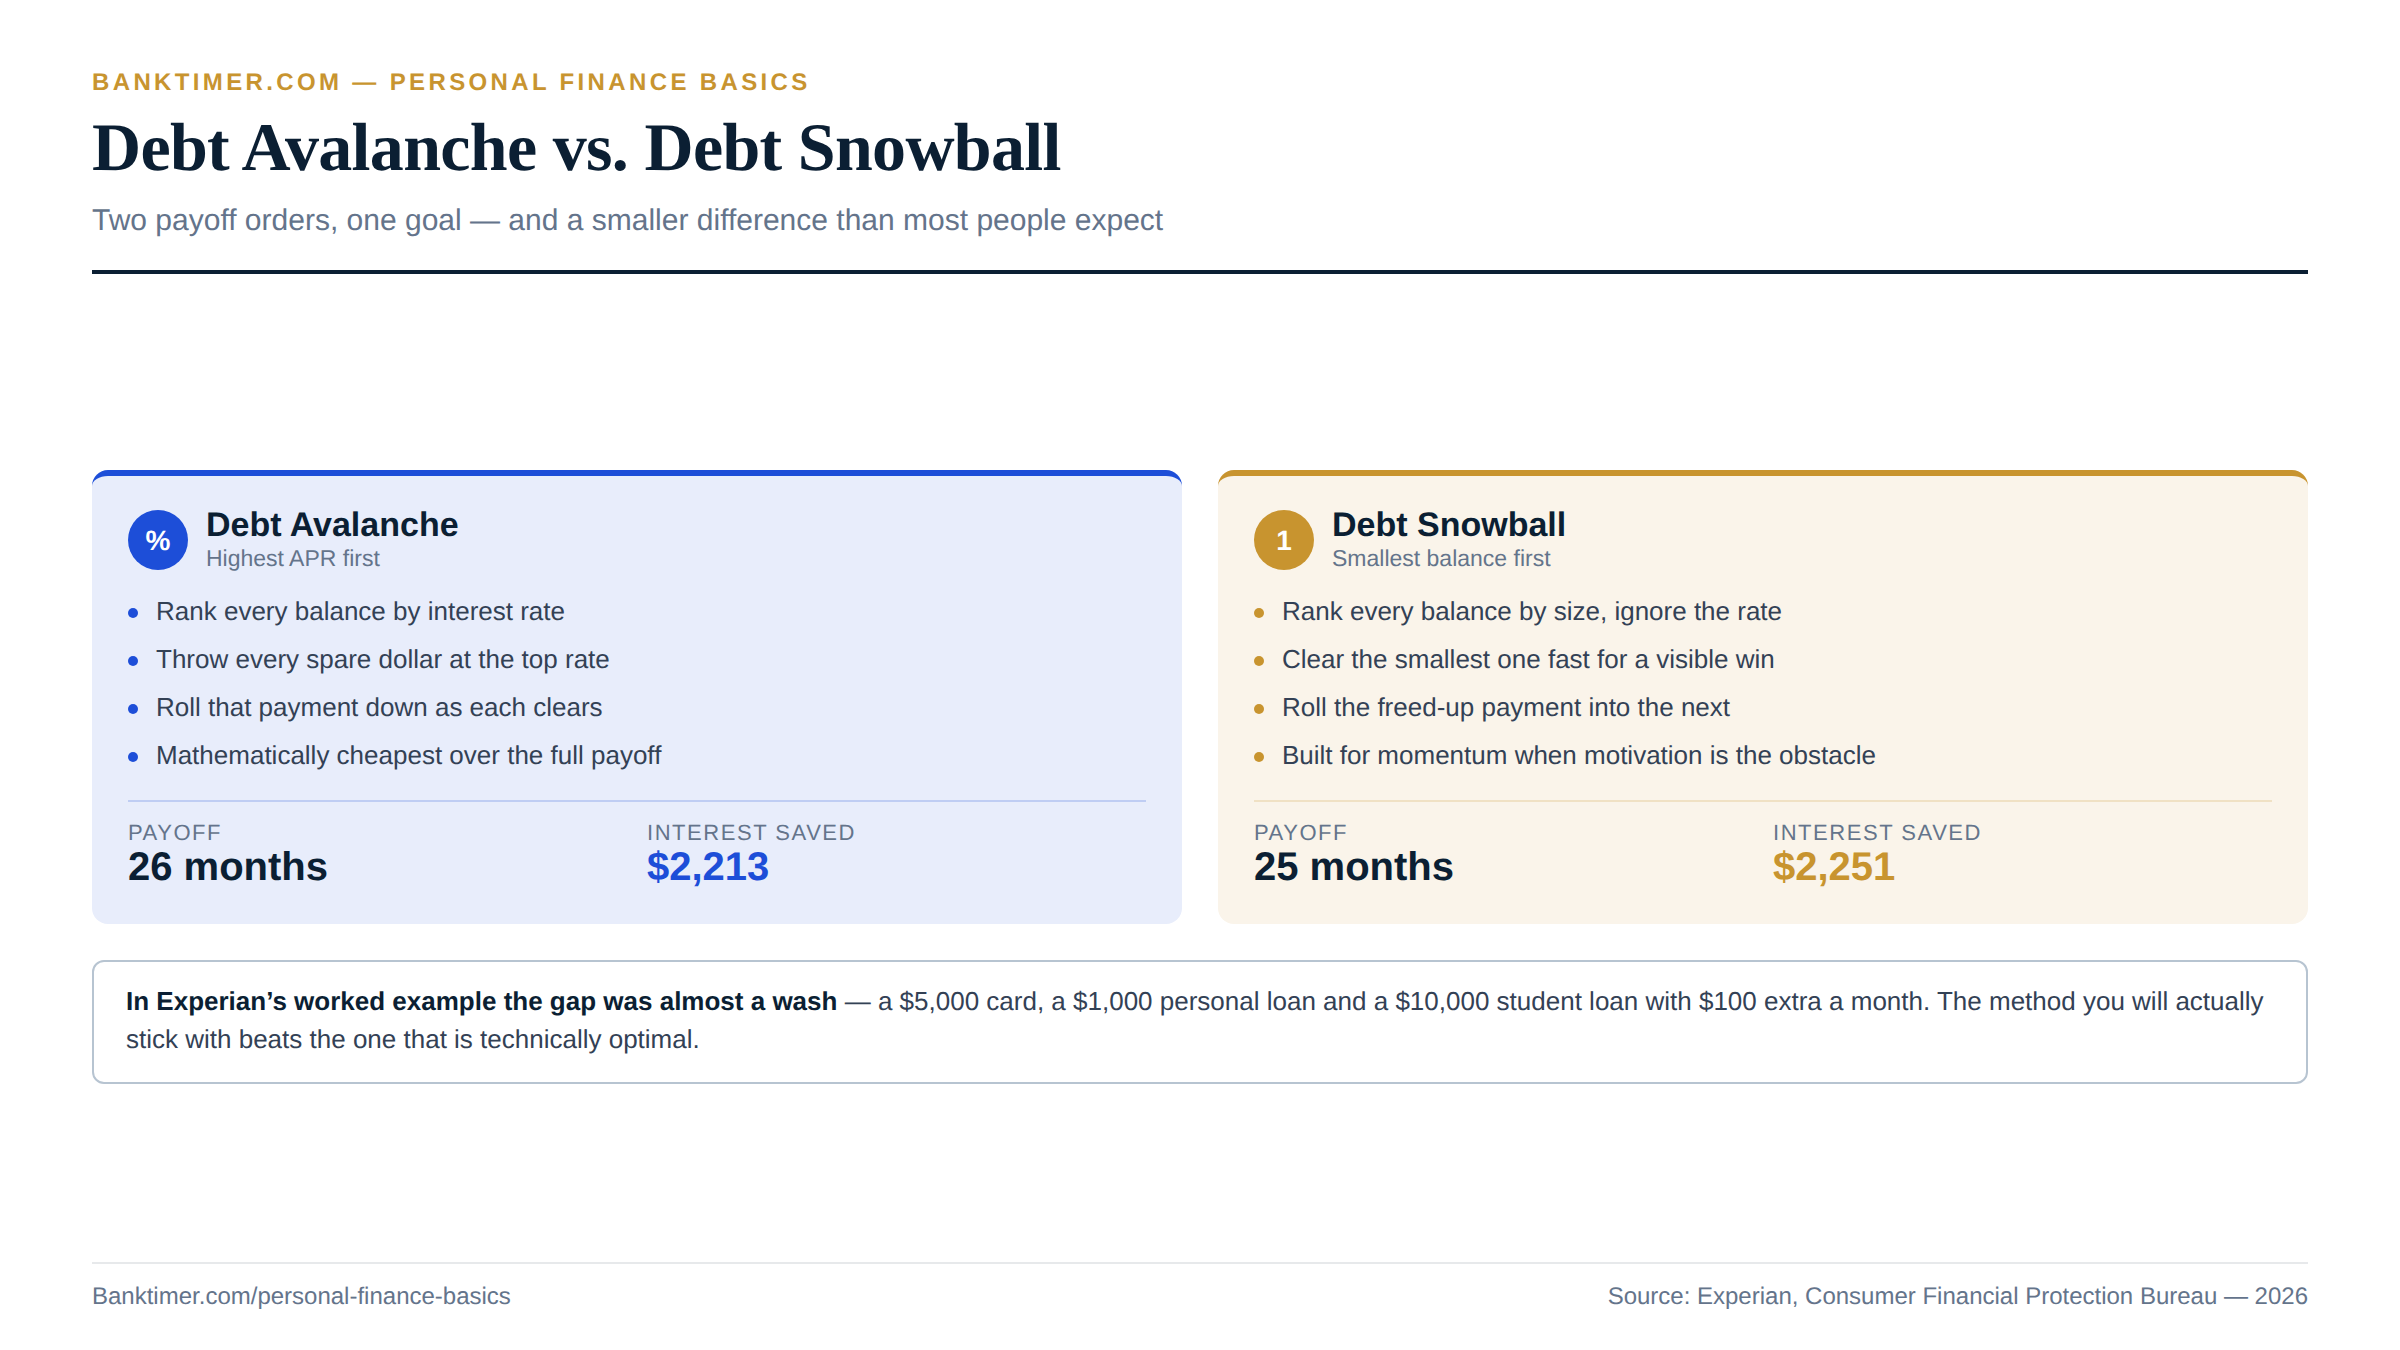
Two competing payoff strategies dominate the personal finance basics conversation around debt. The debt avalanche method ranks debts from highest interest rate to lowest, throws every spare dollar at the highest-rate balance, and rolls that payment forward once it’s paid off. Mathematically, it minimizes total interest.
The debt snowball, popularized by Dave Ramsey, ranks debts smallest balance to largest regardless of rate, so you knock out a full balance fast for a psychological win. In one worked comparison from Experian — a $5,000 card, a $1,000 personal loan, and a $10,000 student loan, plus $100 in extra monthly payments — snowball finished in 25 months and saved $2,251 in interest, while avalanche took 26 months and saved $2,213. The gap was nearly a wash, proof that the method you’ll actually stick with can matter more than the one that’s technically optimal.
How Debt-to-Income Ratio Actually Works
Your debt-to-income ratio, or DTI, is one of the most practical numbers in personal finance. The CFPB defines it simply: total monthly debt payments divided by gross monthly income. Its own example: a $1,500 mortgage, $100 car payment, and $400 in other debt add up to $2,000, which divided by $6,000 in gross monthly income equals a 33% DTI.
Lenders generally like to see 35% or lower. Mortgage underwriters split this into a 28% “front-end” ratio for housing costs alone and a 36% “back-end” ratio for total debt. Under the CFPB’s Ability-to-Repay rule, the general Qualified Mortgage ceiling sits at 43% back-end DTI. Cross roughly 50%, and most lenders flag you as high-risk — LendingTree puts typical maximums at 41-45% for mortgages, 43-50% for credit cards, and 46-50% for auto loans.
Revolving Debt vs. Installment Debt
Revolving debt — credit cards and HELOCs — gives you a credit limit you can borrow against, repay, and borrow against again. Installment debt — mortgages, auto loans, student loans, personal loans — is a fixed amount repaid in scheduled payments over a set term. Revolving debt drives your credit utilization, while installment debt shapes your monthly cash flow for years.
There’s a second axis worth knowing: secured versus unsecured. Secured debt is backed by collateral a lender can seize — a mortgage by the house, an auto loan by the car. Unsecured debt, like most credit cards, personal loans, and medical bills, has no specific collateral behind it, which is exactly why it typically carries a higher rate to compensate the lender for that added risk.
American Debt by the Numbers in 2026
Total Household Debt Tops $18.7 Trillion
Total U.S. household debt reached $18.77 trillion in the second quarter of 2026, according to the New York Fed’s Household Debt and Credit Report. That’s down a slight $13 billion from Q1 2026, but up $383 billion — 2.1% — year over year, and roughly $4.6 trillion higher than at the end of 2019.
Credit card balances alone hit $1.263 trillion in Q2 2026, up $21 billion from the prior quarter and $54 billion from a year earlier. A separate Experian analysis from March 2026 puts total revolving card debt slightly lower, at $1.246 trillion, with the average per-consumer balance at $6,659 — up 0.6% from $6,618 in 2025. The two figures differ because they draw from different credit-bureau samples, not because either one is wrong.
Credit Card Balances and Rates Near Record Highs
Credit card APRs are hovering near record territory too. The Federal Reserve’s G.19 report put the average rate at 20.94% across all accounts and 22.15% on accounts actually charged interest, as of Q2 2026. Experian describes average card APRs similarly, close to record highs around 22%.
That combination — near-record balances and near-record rates — is exactly why credit card debt is the most expensive debt most households carry today. A cardholder paying only the minimum on a $6,659 average balance at 22% APR can watch total interest paid balloon well past the original amount over several years, which is why the payoff strategies covered earlier in this section carry so much weight right now.
What’s Happening With Auto and Student Loan Debt
Auto loan debt climbed to $1.713 trillion in Q2 2026, up $28 billion from the prior quarter, with $211 billion in new originations. Rates stayed high: Bankrate’s weekly survey for the week of September 9, 2026 showed 60-month new-car loans averaging 6.90% and 48-month used-car loans at 7.39%.
Student loan debt sits at $1.651 trillion, per the same NY Fed report, roughly flat quarter over quarter. The average borrower owes $43,619 including private loans, and EducationData.org finds borrowers aged 50-61 carry the highest average balance, at $48,875 — a reminder that student debt isn’t only a young person’s problem.
Delinquency tells a mixed story here. The share of student debt 90-plus days delinquent rose to 10.6% in Q2 2026. But a separate measure — loans transitioning into serious delinquency for the first time — actually fell sharply, from 12.88% a year earlier to 7.83%, since those two figures track different things entirely.
Mortgage and HELOC Debt Keep Climbing
Mortgage debt reached $13.117 trillion in Q2 2026, essentially flat quarter over quarter (the NY Fed attributes the dip mostly to servicer-reporting gaps, not actual payoffs) but up $182 billion year over year. HELOC debt grew for the 17th straight quarter, reaching $459 billion, as homeowners tap equity instead of refinancing a first mortgage into today’s higher rates.
Those rates are a big part of the story. Freddie Mac’s Primary Mortgage Market Survey — the industry benchmark — put the 30-year fixed at 6.76% for the week of September 10, 2026, up from 6.35% a year earlier. A same-day tracker showed 7.08% on September 16, 2026 itself, a one-year high tied partly to the Fed’s rate hike that day. Meanwhile, households are spending more of their income just servicing debt: the Fed’s TDSP series hit 11.16% of disposable income in Q1 2026, trending upward across the year.
A Step-by-Step Plan to Pay Debt Down
Audit Every Debt in One Place First
Every solid debt payoff plan starts the same way: get every debt in one place. List each balance, APR, minimum payment, and due date in a spreadsheet or app — you can’t prioritize what you can’t see clearly. This step is one of the most overlooked personal finance basics, and it takes less than an hour for most households.
Once your list is complete, calculate your DTI using the formula from earlier in this section as a baseline health check. Then choose your method: avalanche if you’re disciplined and the rate gaps between debts are large (a 22% credit card next to a 7% auto loan, for instance), or snowball if motivation is your bigger obstacle than optimization.
Free Up Extra Payment Capacity
Finding extra money to throw at debt usually means revisiting your budget. The well-known 50/30/20 split — 50% needs, 30% wants, 20% savings and debt paydown — gives you a starting framework for identifying how much you can consistently direct toward payoff each month, beyond the minimums you already owe.
Here’s where people quietly sabotage their own progress: spreading small extra payments across several debts instead of concentrating them. Every extra dollar should go to your one target debt — the highest rate under avalanche, or the smallest balance under snowball — while everything else gets exactly its minimum. Consistency beats intensity; a smaller extra payment made every month outperforms a big one made sporadically.
Use Consolidation Tools Deliberately, Not Reflexively
Balance-transfer cards — often offering 0% intro APR for 12 to 21 months — and personal-loan consolidation can genuinely lower your effective interest cost. But only if you avoid re-charging the cards you just paid off, and only if you factor in transfer fees, which typically run 3-5% of the balance moved.
With average card APRs sitting near 22% and personal or auto loan rates running roughly 7-14% depending on credit tier, moving high-rate revolving debt into a lower fixed-rate installment loan is often mathematically attractive right now, especially for borrowers with prime or better credit. That said, the Fed’s September 16, 2026 rate hike is nudging new loan pricing upward too, so the arbitrage window is narrower than it was during 2025’s rate cuts.
Know When to Bring in Outside Help
Sometimes the right move is bringing in a professional — but the type of professional matters enormously. Nonprofit credit counseling agencies, often affiliated with the National Foundation for Credit Counseling, can set up a debt management plan: one monthly payment to the counselor, who distributes it to your creditors, sometimes with reduced interest rates or waived fees.
That’s a fundamentally different animal than for-profit debt settlement, covered next. The CFPB is explicit on this point: legitimate credit counselors, unlike settlement companies, never advise you to simply stop paying your creditors. If a company’s plan hinges on you missing payments, that’s your first clue you’re not dealing with credit counseling at all.
Debt Mistakes, Scams, and What 2026 Changed
Re-Charging Cards You Just Consolidated
One mistake shows up more than any other after a successful debt consolidation: re-charging the cards you just paid off. It’s one of the single most common ways people end up in a worse position than before they consolidated, because now they’re carrying the new loan payment plus fresh revolving balances.
A few other patterns show up almost as often:
- Paying only the minimum on a 22% APR card, which can multiply the original balance in total interest over years.
- Co-signing a loan without realizing you’re 100% liable if the primary borrower stops paying.
- Closing old cards right after payoff, which can shorten your average account age and shrink your available credit — both credit-score factors — right when you’re trying to look stronger financially.
Debt Settlement Red Flags to Know
For-profit debt settlement companies operate very differently from the credit counselors described above, and the CFPB and FTC both flag the same red flag: firms that tell you to stop paying creditors while they “negotiate.” That tanks your credit score, triggers late fees and interest, and can expose you to a collections lawsuit.
Federal law actually limits how these companies can charge you. Under the FTC’s Telemarketing Sales Rule, they can’t collect a fee until they’ve settled at least one debt, you’ve agreed to that settlement, and you’ve made at least one payment toward it. Any company demanding money upfront is breaking that rule. One more catch pitches often skip: forgiven debt is frequently taxable as income, triggering a 1099-C form you’ll owe taxes on.
Credit Repair Scams and the Law Behind Them
The FTC lists specific red flags for credit repair scams: companies that demand payment before doing anything, that tell you not to contact the credit bureaus yourself, that ask you to dispute information you know is accurate, or that tell you to lie on a credit application.
The most serious version asks you to file a false identity-theft report or apply for a new taxpayer ID to build a “new credit identity” — that’s illegal file segregation, and it can amount to fraud. The Credit Repair Organizations Act requires a written contract disclosing services, total cost, and timeline, plus a 3-day right to cancel, and flatly bans collecting fees before the promised work is actually delivered.
How the September 2026 Rate Hike Raises the Cost of Debt
The Fed’s September 16, 2026 decision to raise the federal funds rate 0.25 points, to a 3.75%-4.00% target range, was its first increase in roughly three years, after cuts through late 2025 had pushed rates lower. The vote was unanimous, 12-0, with the Fed citing inflation that “remains elevated” — August 2026’s reading came in at 3.4% annually, worsened by an oil-price shock that pushed diesel to a record $6.31 a gallon.
For anyone carrying debt, this matters immediately. Credit cards, new auto loans, new personal loans, HELOCs, and adjustable-rate mortgages all move with the prime rate almost right away, raising borrowing costs just as household debt-service burden was already climbing. It’s also worth knowing that federal oversight of debt collectors and consolidation firms has shrunk considerably as CFPB funding and staffing were cut, which puts more of the burden on you to spot the red flags above yourself.
Emergency Funds
An emergency fund is the piece of personal finance basics that makes every other plan possible, because it’s the buffer between a surprise expense and a debt spiral. Budgeting tells you where your money goes, and a good savings account tells you where to keep it, but an emergency fund is the specific reason both of those exist. Nearly six in ten Americans currently couldn’t cover a $1,000 emergency without borrowing, which tells you this isn’t a hypothetical problem. This section covers what the fund is actually for, how prepared people really are, and how to build one without it taking forever.
What an Emergency Fund Is Actually For
The Three-to-Six-Month Rule, and What It Really Means
The standard benchmark is simple to state: keep three to six months of essential expenses in savings — not your whole budget, just the fixed core of it. That means rent or mortgage, utilities, groceries, insurance, and minimum debt payments; it doesn’t include dining out or streaming subscriptions.
The distinction matters because using your full monthly spending inflates the target unnecessarily and can make the goal feel impossible before you start. Calculating the essentials-only number first is one of the more practical personal finance basics in this guide, because it turns an abstract rule into a specific dollar figure you can actually save toward.
Why the Right Number Depends on Your Job
Three to six months isn’t one-size-fits-all; it’s a range that should shift with how stable your income actually is. A dual-income household with two stable W-2 jobs can reasonably aim for the lower end, around three months. A single-income household, or someone in a volatile industry, should lean toward four to six months.
Gig workers, freelancers, and the self-employed face the least income certainty and no employer-provided unemployment cushion, so financial educators generally recommend six to nine months or more. Before picking a number, be honest about which category actually describes your situation instead of defaulting to whatever number you’ve seen most often online.
Matching the target to your actual job stability, rather than copying a friend’s number, is one of the personal finance basics that gets skipped most often — and it’s usually the reason a “correct” emergency fund still feels wrong for the person holding it.
Dave Ramsey’s $1,000 Starter Fund, Debated
Dave Ramsey’s “Baby Steps” program has savers build a $1,000 starter fund before aggressively attacking debt, saving the full 3–6 month fund for later. Critics have called the flat $1,000 figure a “relic of the 90s,” noting it barely covers a modest car repair after years of inflation, according to Yahoo Finance.
Ramsey has pushed back, saying the number was never meant to be a full emergency fund — it’s a psychological tool to preserve momentum during debt payoff, not a complete safety net. Both points can be true at once: $1,000 is a reasonable starting milestone, but treating it as a finished emergency fund in 2026 is a mistake.
Where an Emergency Fund Should Actually Live
The expert consensus here is remarkably consistent: an emergency fund belongs in a liquid, FDIC-insured high-yield savings account or money market account. Not a CD, which penalizes early withdrawal exactly when you’d need the cash. Not the stock market, which can be down 20% the same month your car transmission fails. And not a checking account paying 0.01%, which quietly costs you real interest for no safety benefit.
Some financial writers, including the White Coat Investor, argue that Roth IRA contributions — which can be withdrawn tax- and penalty-free at any time — can serve as a quasi-emergency layer, letting you save and invest simultaneously instead of strictly sequencing the two.
How Prepared Americans Really Are in 2026
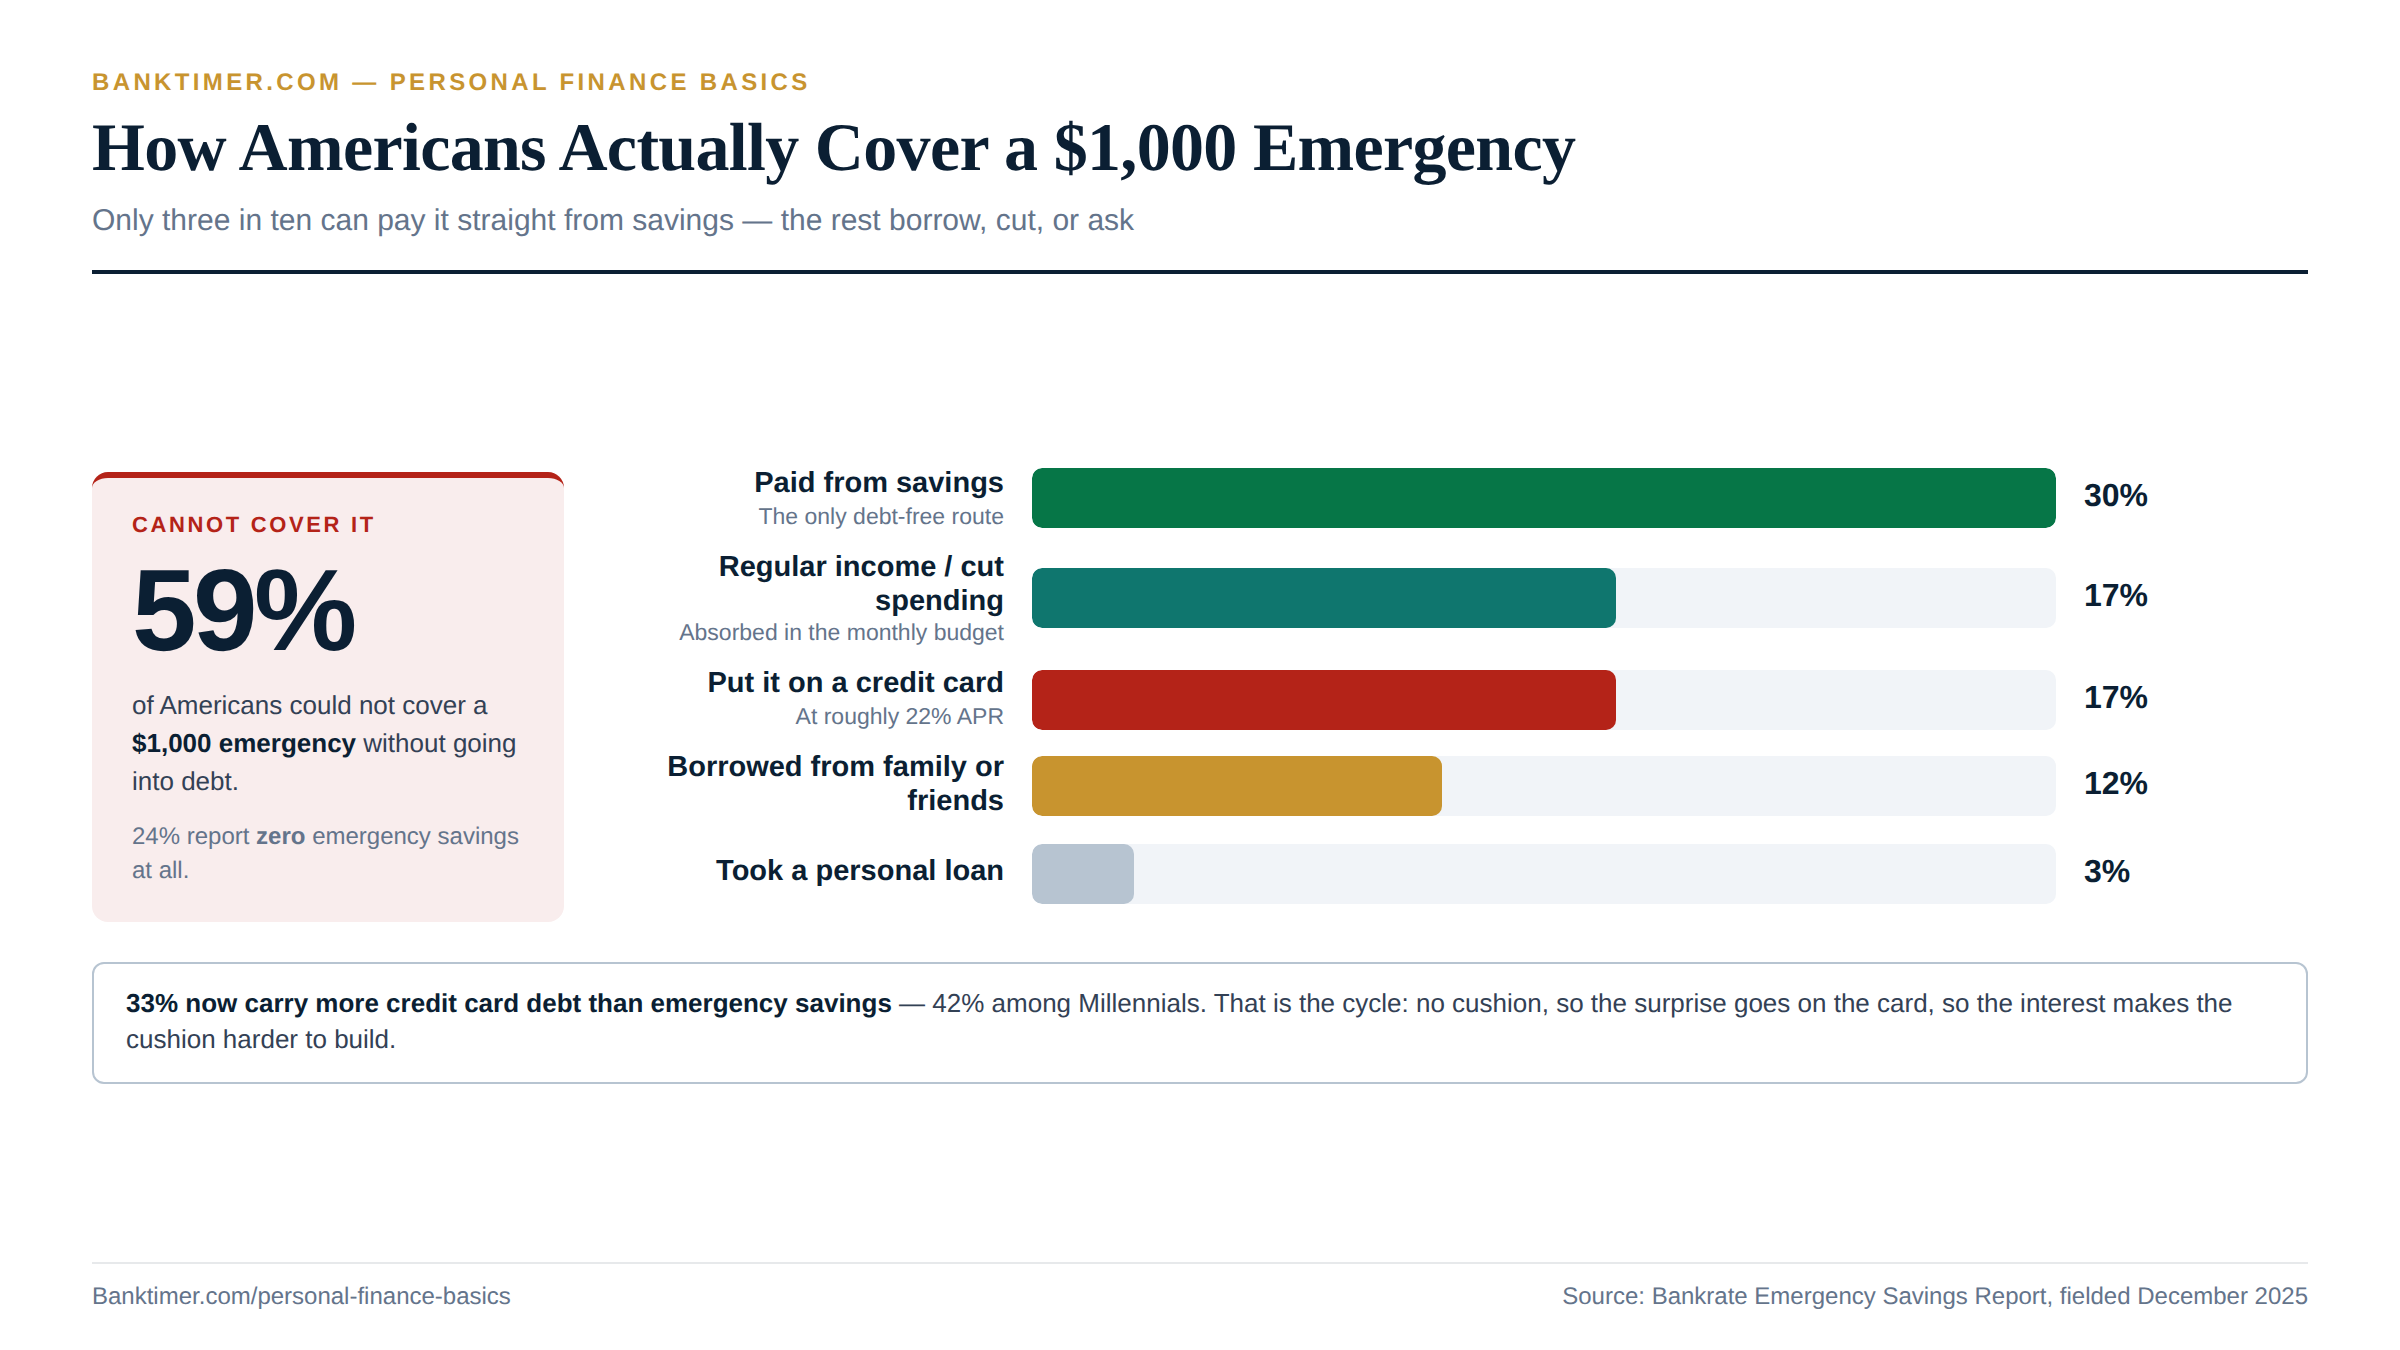
Fifty-Nine Percent Couldn’t Cover a $1,000 Emergency
According to Bankrate’s 2026 Emergency Savings Report (fielded in December 2025), 59% of Americans cannot cover a $1,000 emergency expense without going into debt. Only 30% could pay it directly from savings, and 24% report having zero emergency savings at all.
Asked how they’d actually cover a surprise $1,000 bill, 17% said they’d rely on regular income or cash flow, another 17% said credit cards, 12% said they’d borrow from family or friends, and just 3% pointed to a personal loan. The Federal Reserve tracks a related, stricter test in its annual well-being survey — whether adults can cover a $400 emergency using cash alone — and its ongoing tracking tells a similarly uneven story about household resilience.
Emergency Savings by Generation
Preparedness varies by age, but not always in the direction you’d expect. Baby Boomers report the highest ability to cover a $1,000 emergency from savings, at 33%, followed by Gen Z at 31%, Gen X at 29%, and Millennials at just 27%, per Bankrate’s 2026 data.
Median emergency fund balances tell a similar story: Empower’s 2025 survey found Gen Z holding a median of just $400, compared to $5,000 for Gen X and $3,000 for Millennials. Millennials — often squeezed between student debt, childcare costs, and high housing prices — show up as one of the least prepared generations despite being deep into their prime earning years.
More Credit Card Debt Than Emergency Savings
One of the more uncomfortable 2026 statistics: 33% of Americans now carry more credit card debt than they hold in emergency savings, according to Bankrate. Among Millennials specifically, that number jumps to 42%, and Gen X sits at 39%.
That combination — high-interest debt outpacing the fund meant to prevent more debt — is a genuinely dangerous cycle. A surprise expense hits, it goes on the card because there’s no cushion, and the resulting interest charges make it even harder to build a cushion afterward. Breaking the cycle usually means directing new cash toward the smaller of the two problems first, rather than waiting for one to be finished before starting the other.
Why Emergency Savings Fell Even in a Strong Economy
Emergency savings actually worsened between Bankrate’s December 2024 wave and its December 2025 wave, even with unemployment holding around 4.1%. Respondents cited inflation as the top reason (54%), ahead of income changes (26%) and, notably, recent rate cuts reducing the appeal of saving (17%) — a factor that predates September 2026’s hike and may reverse in future surveys.
The takeaway is that a strong headline economy doesn’t automatically translate into household resilience, because rising prices for groceries, insurance, and housing can outpace wage growth even when jobs are plentiful. That gap between “the economy is fine” and “my budget is fine” is exactly why emergency-fund preparedness deserves its own check-in, separate from the unemployment rate.
How to Build One Without It Taking Forever
Set a Realistic First Milestone
Trying to save three to six months of expenses in one leap is exactly the kind of goal that stalls before it starts — which may help explain why 24% of Americans report zero emergency savings at all. Start smaller. A $500 to $1,000 starter fund, in the spirit of Ramsey’s Baby Step 1, gives you real momentum and an actual cushion within weeks rather than years.
Hitting that first milestone matters psychologically as much as financially, because it proves the habit works before you ask yourself to sustain it for months. From there, scale up toward your full target in stages rather than trying to solve the whole number at once.
Automate It Into a Separate Account
Apply the same pay-yourself-first mechanics from the Saving Money section here: automate a fixed transfer into a dedicated HYSA on payday, ideally at a different bank than your everyday checking account. That small separation matters more than it sounds.
Money that’s one click away in the same banking app gets “borrowed” for non-emergencies far more easily than money that requires logging into a second bank. Automating the transfer also means the fund keeps growing during busy months when you wouldn’t have gotten around to a manual one — consistency beats intensity here.
Size the Target to Your Actual Risk
Once the starter fund is in place, size your real target to your actual risk profile rather than a flat number pulled from an article. Dual-income, stable-job households can reasonably stop around three months of essential expenses. Single-income households or people in cyclical industries should aim for four to six.
Freelancers, commission-based workers, and the self-employed are better served by six to nine months or more, given the lack of an employer-provided cushion. Revisit that number after any major life change — a new dependent, a new mortgage, a shift to self-employment — since the right figure moves as your life does.
Replenish It Immediately After Any Use
An emergency fund isn’t meant to be a permanent, static balance — it’s meant to be used and then rebuilt. After any withdrawal, treat replenishing it as a mandatory line item in your budget, not a someday goal. This is where the fund connects directly back to budgeting basics: the automated transfer that built it the first time is the same tool that rebuilds it afterward.
Letting a used fund quietly become the new normal is a common trap. It slowly erodes your safety net exactly as more emergencies become statistically likely, since real-world emergencies tend to cluster rather than space themselves out evenly.
Emergency Fund Mistakes and the Fine Print to Watch
Treating a Sinking Fund Like an Emergency Fund
It’s tempting to dip into “savings” for a planned expense — holiday gifts, an annual insurance premium — without noticing that it’s actually your emergency fund you’re spending down. The fix is structural: keep sinking funds, for predictable known costs, in a separate labeled account or bucket from your emergency fund, which exists for the unplanned kind.
Many HYSAs now support sub-accounts specifically so you can automate both without the mental math of tracking one shared pool. Skipping this separation is one of the sneakier personal finance basics people get wrong, because each individual withdrawal feels reasonable — it’s only in aggregate that the cushion quietly disappears.
Investing Money You Might Need Next Month
Putting emergency savings into stocks or ETFs to chase a better return is one of the costliest mistakes on this list, because it ties your safety net to market timing. If a real emergency hits during a downturn — and downturns are, by definition, unpredictable — you’re forced to sell at a loss exactly when you can least afford one.
The entire point of an emergency fund is that it’s available at full value on short notice; a brokerage account can’t promise that. Keep growth investing and emergency savings in completely separate buckets, no matter how good recent market returns have looked.
Locking It in a CD With an Early-Withdrawal Penalty
A CD’s fixed rate looks tempting next to a 0.38% national savings average, but locking emergency money into one defeats the fund’s entire purpose. Early-withdrawal penalties on CDs typically claim several months of interest, sometimes more, and you’ll pay that penalty at the exact moment you can least afford to lose any of it.
If you want a guaranteed rate, apply that instinct to money with a known future date instead, through CD laddering, and keep true emergency savings in a liquid HYSA where you can withdraw the full balance within a day or two, penalty-free, whenever you actually need it.
Reading the Fine Print on “Up to 10% APY” Ads
Ads promising savings accounts paying “up to 10% APY” have become more common in 2026, and they deserve real skepticism. WalletHub’s September 2026 listings show these headline rates typically apply to reward-checking-style products with narrow qualifying conditions: small balance caps, a minimum number of monthly debit swipes, or a bonus tier that applies to only the first few hundred dollars.
The realistic blended return is usually far closer to a normal HYSA rate than the headline number suggests. With reduced federal oversight of nonbank fintech products in 2026, reading the actual terms yourself — not just the ad’s biggest number — is now squarely your job as the saver, not the regulator’s.
Financial Goals
Every dollar you save, invest, or put toward debt works better when it’s aimed at something specific. That’s the whole point of setting financial goals: turning general advice into a number and a deadline you can actually act on. This section covers the personal finance basics of goal-setting — the framework, the 2026 numbers that should shape your targets, a step-by-step plan, and the scams that prey on people chasing a goal faster than they should.
How to Actually Set a Financial Goal
The SMART Framework, Applied to Money
The SMART framework turns vague financial wishes into something you can actually execute. Specific means naming the exact goal — “save $15,000 for a home down payment,” not “save more.” Measurable means attaching a number and a way to track it, whether that’s a dollar amount or a percentage paid off.
Achievable means sizing the goal to your real income and expenses — a stretch, not a setup for failure. Relevant ties the goal to your actual priorities rather than a generic benchmark you found online. And time-bound means a start date and a target date, because a deadline is what actually produces the monthly savings number you need to hit.
Short-, Medium-, and Long-Term Goals
Financial goals generally fall into three time horizons, a widely used convention rather than an official government standard. Short-term goals — under a year — might be building a starter emergency fund, paying off a small credit card balance, or saving for a vacation.
Medium-term goals, roughly one to five years out, include a home down payment, a car purchase, or building a full three-to-six-month emergency fund. Long-term goals, five-plus years away, cover retirement savings, a child’s education fund, or paying off a mortgage early. Matching your goal to the right horizon is what determines which account you should actually use, which is exactly where we’re headed next.
Matching Each Goal to the Right Account
Short-term goals belong in a standard or high-yield savings account: liquid, FDIC-insured, and free of market risk. That choice matters more than it sounds: as of September 2026, top nationally available high-yield accounts were paying around 4.00-4.10% APY, dramatically above the roughly 0.63% national average across all banks.
Medium-term goals can mix high-yield savings with short-duration CDs, generally staying out of the stock market for money you’ll need within a few years. Long-term goals — retirement, decades out — belong in tax-advantaged accounts like a 401(k), 403(b), or IRA, invested in a diversified, typically equity-heavy portfolio, especially where an employer match is on the table.
Getting this matching wrong in either direction costs you. Parking a down-payment fund in the stock market risks a bad-timing loss right before you need the cash; leaving retirement money sitting in a savings account for decades quietly forfeits decades of compounding growth. The account you choose should follow the goal’s timeline, not your comfort level with any one type of account.
Needs vs. Wants: The Budgeting Overlay
Goals don’t fund themselves; they need a source, and that’s where budgeting overlaps with goal-setting. The same 50/30/20 framework used across these personal finance basics (50% needs, 30% wants, 20% savings and debt paydown) gives you a simple way to find the “20%” that actually funds your goals.
That’s the same pool of money discussed in the debt section’s guidance on freeing up extra payment capacity, which is exactly why goals and debt payoff usually need to be ranked against each other rather than funded in isolation. You’ll see that ranking process later in this section.
What 2026’s Numbers Mean for Common Goals
Emergency Fund Targets Amid Rising Debt Service
Standard guidance hasn’t changed: build three to six months of essential living expenses into an accessible account, leaning toward the higher end if you’re a single-income household or have variable income. What has changed is the cost of not having one.
Household debt-service payments climbed to 11.16% of disposable income in Q1 2026, and average credit card APRs sit near 22%. A household without an emergency fund that leans on a credit card for a surprise expense is borrowing at a very expensive rate at a moment when overall debt burdens are already trending upward, making this goal more urgent, not less, in 2026.
Retirement Contribution Limits for 2026
The IRS raised retirement contribution limits for 2026: the 401(k)/403(b) employee deferral limit rose to $24,500, up from $23,500, and the IRA limit climbed to $7,500, up from $7,000. SIMPLE plans rose to $17,000.
Catch-up contributions for savers 50 and older got a boost too: the standard 401(k)-style catch-up is $8,000 (for a $32,500 total), with an enhanced $11,250 catch-up available for ages 60-63 specifically (a $35,750 total). IRA catch-up contributions add $1,100, for an $8,600 total, and SIMPLE plan catch-ups rose to $4,000 standard or $5,250 for the 60-63 window. If retirement is one of your long-term goals, that’s simply more tax-advantaged room to work with than you had in 2025 — and it’s worth adjusting your automated contribution percentage now rather than waiting until January to notice the limit moved.
Homebuying Goals at Today’s Mortgage Rates
If a home purchase is on your goal list, today’s rates change the math meaningfully. Freddie Mac’s official survey put the 30-year fixed at 6.76% for the week of September 10, 2026, and a same-day tracker showed 7.08% on September 16 itself — both well above the 6.35% seen a year earlier.
That means the same target home price now requires either a bigger down payment or a materially higher monthly payment than it did in 2025. Anyone setting or re-checking a homebuying goal right now should rebuild the monthly savings target around today’s rate, not last year’s, or risk finishing the goal only to discover the math has moved out from under them.
Treating Debt Payoff as a Goal in Its Own Right
It’s worth treating debt payoff as a formal goal on your list, not just a separate topic. A high debt-to-income ratio can disqualify a mortgage application even after you’ve saved the full down payment, since lenders cap DTI around 43-45% regardless of how much cash you’re bringing to the table.
Framing it as “get my DTI under 35%” gives you the same specific, measurable, time-bound structure the SMART framework calls for elsewhere in this section, and it reinforces just how connected these personal finance basics really are. Debt and goals aren’t separate problems; they compete for the exact same monthly dollars.
A Step-by-Step Approach to Reaching Your Goals
Run a Goal Audit and Force-Rank Priorities
Start by listing every financial goal you have — emergency fund, debt payoff, a house, retirement — and applying the SMART criteria to each one. Then force-rank them, because trying to fund five goals at once with limited monthly capacity usually means none of them move meaningfully.
A common sequencing convention works well for most households: minimum debt payments plus a starter emergency fund of $1,000-$2,000 first, then your employer’s 401(k) match if one’s offered (it’s an immediate, guaranteed return), then high-interest debt payoff, then a full three-to-six-month emergency fund, with other goals layered in afterward.
Write the ranked list down somewhere you’ll actually see it — a note on your budgeting app, a sticky note on your monitor, whatever sticks. The point of ranking isn’t the exercise itself; it’s having an answer ready the next time a bonus or tax refund lands and you have to decide, in the moment, where it goes.
Automate the Goal Before You Can Talk Yourself Out of It
Willpower is an unreliable savings strategy. Set up automatic transfers timed to payday — the classic “pay yourself first” approach — into goal-specific accounts before discretionary spending gets a chance to eat into that money.
Many high-yield savings providers now support multiple named sub-accounts or “buckets,” so you can automate transfers into a house fund, a vacation fund, and an emergency fund separately without opening three different bank relationships. The goal happens automatically, which means it happens even on months when your motivation doesn’t show up.
Review Progress on a Fixed Cadence
Set a fixed review cadence rather than checking sporadically: a quick monthly look to confirm the automation is running, and a deeper quarterly review to ask harder questions. Is the automated amount still realistic given any changes to your income or expenses?
Life changes should trigger a goal review even outside the normal schedule. A new dependent, a shift to variable income, or new debt can all mean your emergency-fund target or savings rate needs to flex. Treat the cadence as a floor, not a ceiling.
Re-Price Goals When Rates Change
A Fed move like the September 16, 2026 hike is a concrete prompt to re-check two things. First, are your savings and CD accounts still competitive? The gap between the roughly 0.63% national average and the roughly 4% top-tier rate is wide enough that rate-shopping meaningfully affects goal progress.
Second, does any goal that depends on borrowing — a house, a car — need a revised monthly savings target or timeline given the higher cost of that debt? Turning a macro news event into two specific checks against your own goal list is what separates a passive saver from someone actively managing their personal finance basics.
Goal-Setting Mistakes and Scams to Avoid
Vague Goals With No Number or Date
A goal like “save more” or “get out of debt” sounds reasonable, but it can’t be tracked, automated, or even judged as successful. Without a specific number and a target date, there’s no way to know how much to transfer each payday or whether you’re actually on pace.
The fix is simple, if not always comfortable: rewrite every vague goal using the SMART framework from earlier in this section. “Save more” becomes “save $6,000 for a car down payment by next August” — a goal you can actually automate and measure.
Funding Too Many Goals at Once
Spreading your monthly savings capacity across five goals at once feels responsible, but it usually means every single one progresses slower than it needs to. A little bit toward the house fund, a little toward retirement, a little toward a vacation, and none of them arrive meaningfully faster.
The sequencing convention covered earlier in this section exists precisely to solve this problem: rank your goals, fully fund the top priorities first, and let lower-ranked goals wait their turn rather than crawling forward alongside everything else.
“Goal Acceleration” Investment Scams
Watch for pitches that promise to dramatically accelerate a specific goal — “double your house down payment in six months” through a proprietary trading system, a crypto arbitrage bot, or a “guaranteed” high-yield investment club. These share the exact same red flags covered in the net worth section’s wealth-secret scams: guaranteed returns, urgency, and unverifiable licensing.
Before sending money to any platform promising to fast-track a goal, check the operator against FINRA BrokerCheck or the SEC’s Investment Adviser Public Disclosure database. A legitimate way to speed up a goal is a higher savings rate or a better interest rate, not a system nobody else has apparently discovered.
Mismatching Risk Tolerance to Time Horizon
Putting money you’ll need within a year or two into the stock market, chasing a higher return, exposes your goal to sequence-of-returns risk: a downturn right before you need the money can permanently impair a goal that had nothing to do with long-term investing in the first place.
This is exactly why the account-matching guidance earlier in this section — savings and CDs for short-term goals, equities mainly for long-term ones — matters as much as how much you actually save. The vehicle you choose can make or break a goal just as much as the savings rate behind it.
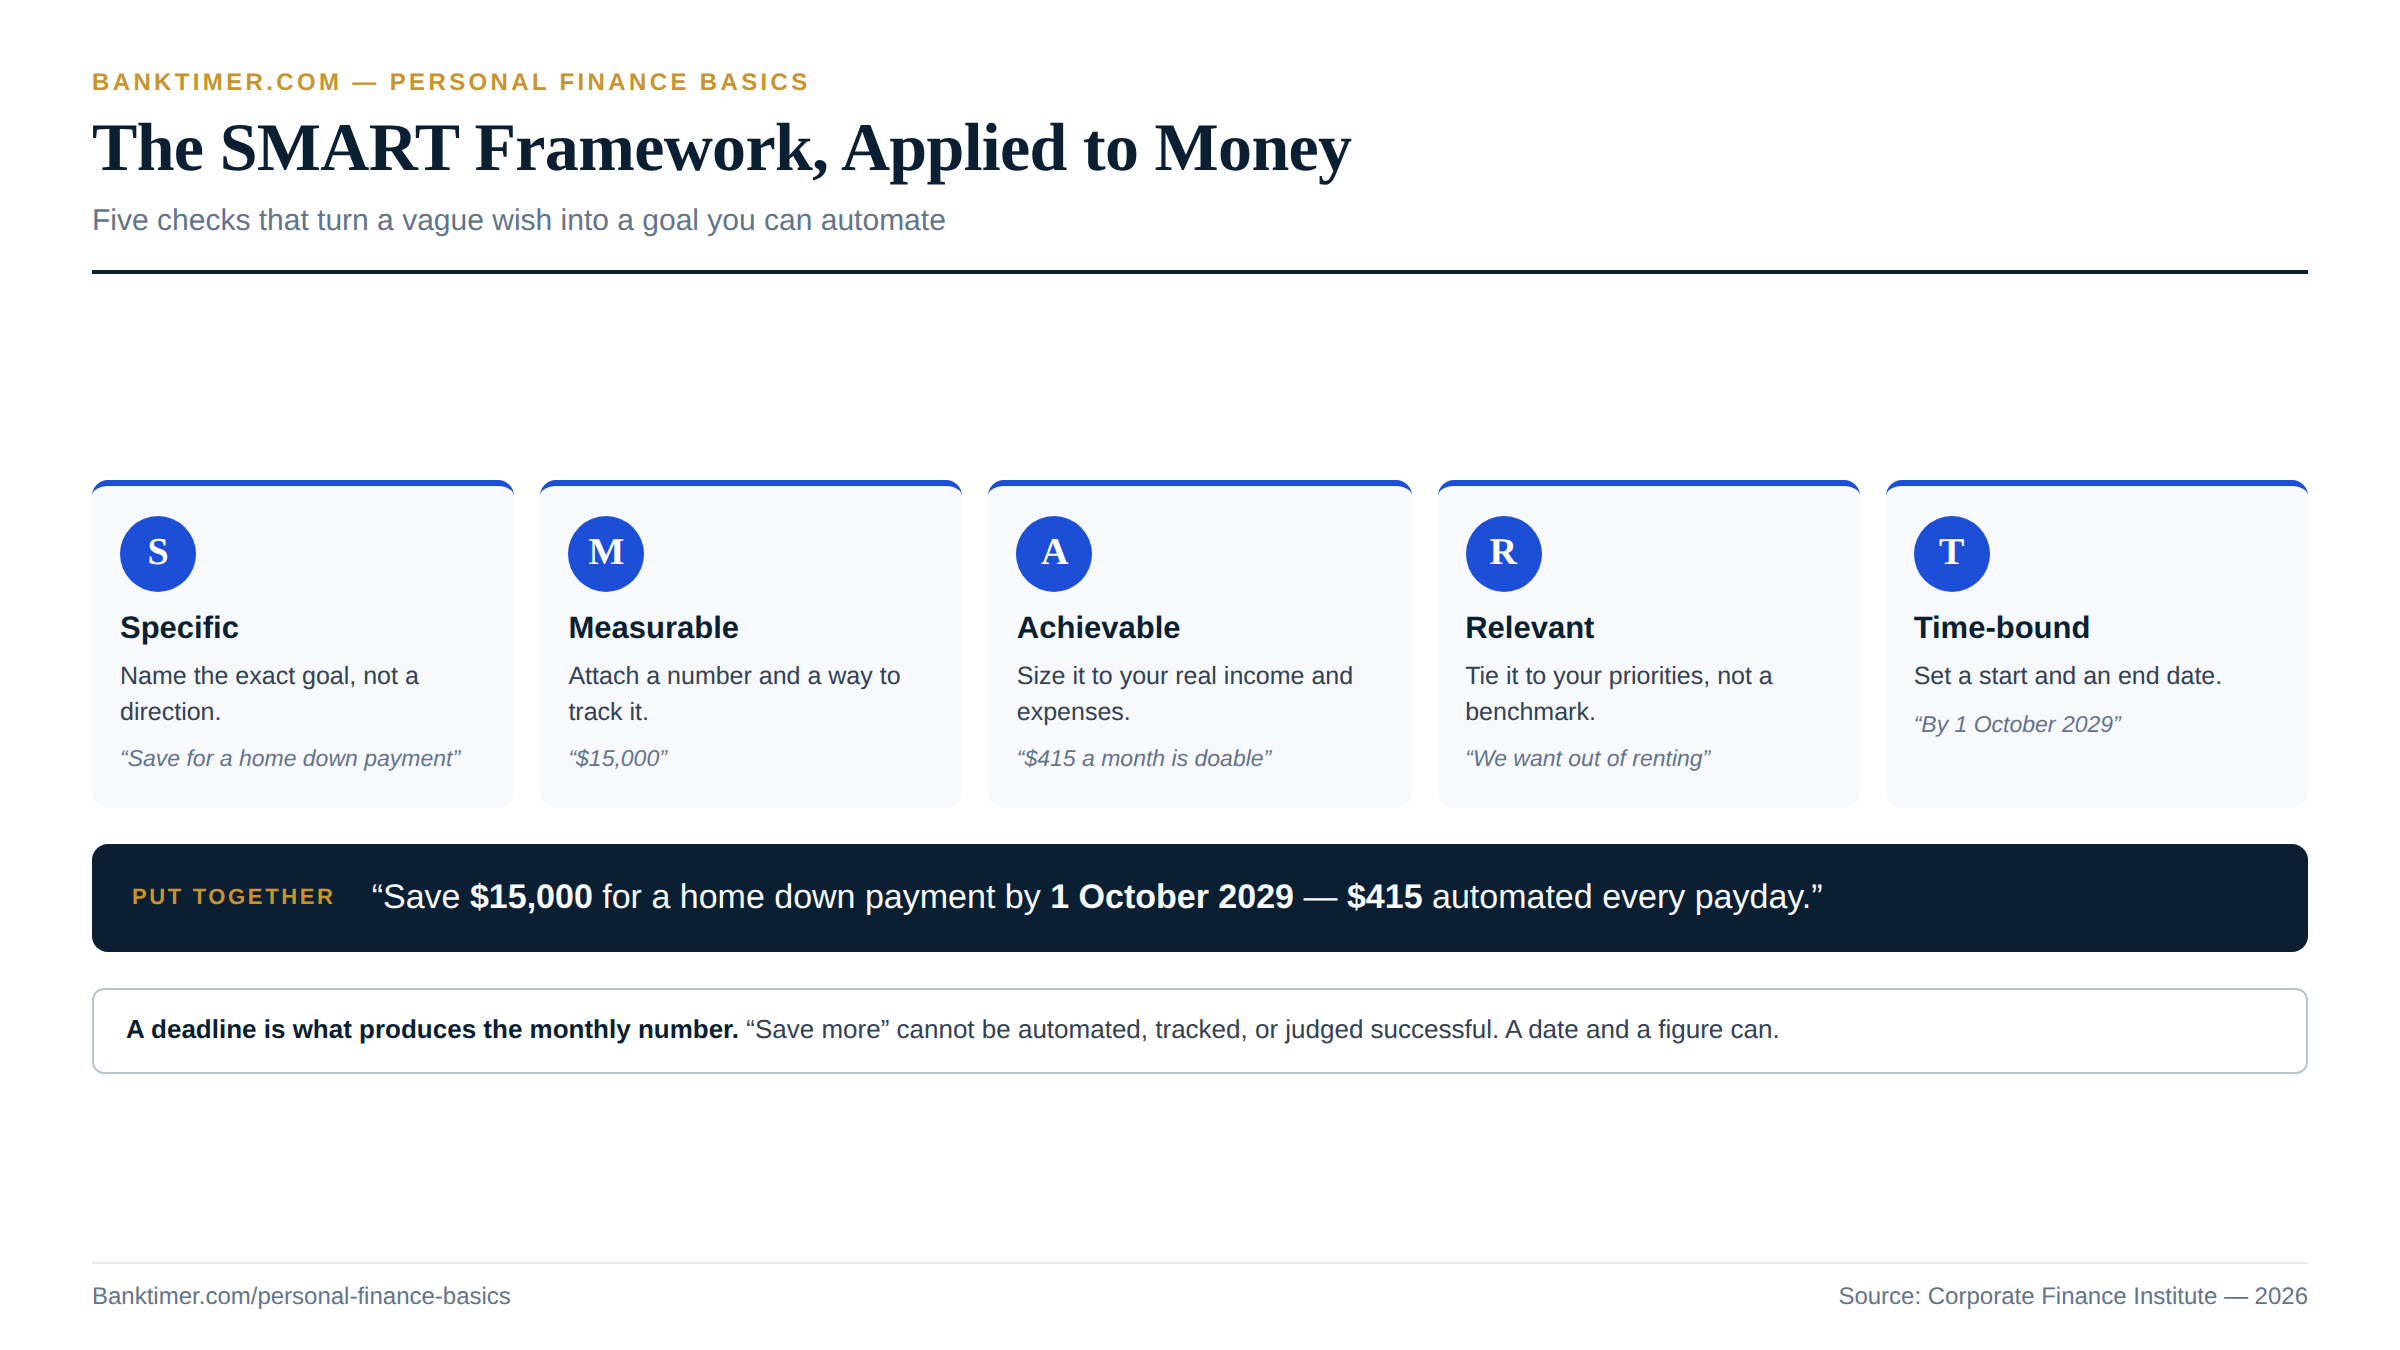
Household Costs
Cost of living is about comparing places. Household costs are about the actual line items sitting inside your checking account every month. This is the ground-level view of personal finance basics — not an index score, but the real dollars going to rent, groceries, the car, and the kids. Get a handle on these categories, and everything else in your financial plan gets easier to build.
The federal government has its own vocabulary for this. The Bureau of Labor Statistics tracks spending by “consumer unit.” That term covers a family, a single person living independently, or any group sharing major expenses. It’s close enough to “household” for everyday use. It’s worth knowing, though, if you ever dig into the underlying data yourself.
What Actually Makes Up a Household Budget
Housing: The Biggest Line Item by Far
Housing is consistently the largest category in any household budget, and 2024 data confirms it isn’t close. The average consumer unit spent $26,266 on housing that year — 33.4% of total spending — according to the Bureau of Labor Statistics. That figure bundles shelter, utilities, and household operations together.
Housing costs also grew faster than overall spending in 2024, rising 3.3% against 1.8% growth in total expenditures. Whether you rent or own, this category deserves the most scrutiny in any household budget. It simply carries too much weight to ignore.
It also helps to sort every cost — housing included — into fixed, variable, or periodic buckets. Fixed costs, like rent and loan payments, stay steady month to month. Variable costs, like groceries and seasonal utilities, fluctuate. Periodic costs, like annual insurance and car registration, hit once a year. Missing that third bucket is the single most common budgeting failure mode.
Transportation Costs Beyond the Car Payment
Transportation ranks second at $13,318 annually, or 17.0% of the average household budget. The mistake here is judging affordability by the loan payment alone. Total cost of ownership also includes insurance, fuel, and maintenance — costs that don’t disappear once the loan is approved.
The average new-vehicle transaction price hit $50,089 in August 2026, per Cox Automotive. Financing terms now matter enormously to what a car actually costs a household each month, well beyond the sticker price. Two households can finance the same car at different rates. They can end up with very different real transportation costs, even with an identical loan payment on paper.
Food, Utilities, and Healthcare
Food accounted for $10,169 (12.9%) of the average 2024 budget, with utilities folded into the housing category above. The at-home versus away-from-home split is worth tracking. Food at home rose 2.2% year-over-year in August 2026, while food away from home rose faster, at 3.4%.
Grocery prices move at the item level, not as one uniform number. Eggs averaged $2.14 a dozen in mid-2026, falling as 2025’s shortage-driven spike unwound. Ground beef climbed to $6.83 a pound, up 11.8% year-over-year, and milk rose to $4.32 a gallon. “Grocery inflation” is really a basket of very different item-level stories.
Healthcare added $6,197 (7.9%) to the average budget in 2024, and pressure keeps building on top of that number. KFF’s 2025 employer survey found average family premiums at $26,993, with workers paying $6,850 of that directly from their paychecks. More than a third of large employers cited prescription drug prices as a major driver.
Childcare and Its Outsized Impact
Childcare doesn’t get its own line in the BLS breakdown, but it can dwarf several categories combined for families with young children. The national average runs $13,184 a year — about $1,099 a month. Infant care costs the most, due to state-mandated staffing ratios.
The state-by-state spread is enormous. Mississippi averages $6,840 a year, while Washington, D.C. runs $24,243 — a 3.5x difference. Massachusetts and California aren’t far behind, at $21,840 and $19,719. For any household with young kids, ignoring this line item is one of the more expensive personal finance basics to get wrong.
What Households Actually Spend in 2026
Average Annual Household Spending
The latest available government data — calendar-year 2024, released December 19, 2025 — puts average household spending at $78,535, up 1.8% from $77,158 in 2023. Average pre-tax income rose to $104,207 over the same period, according to BLS.
This is not 2026 spending data, and shouldn’t be treated as such. It’s simply the most recent full-year figure available. It still offers a useful structural baseline, even while individual categories keep moving in real time.
Budgeting off take-home pay alone skews any comparison to this average. It ignores pre-tax deductions like 401(k) contributions, HSA funding, and insurance premiums. A household earning close to $104,207 but funneling a large share pre-tax will look poorer on paper than one that doesn’t. Their actual spending power, though, can be very similar.
How Spending Breaks Down by Category
Housing leads at 33.4%, followed by transportation at 17.0% and food at 12.9%. Personal insurance and pensions take another 12.5%, healthcare 7.9%, entertainment 4.6%, cash contributions 2.9%, apparel 2.5%, and education 2.0%, with the remainder spread across smaller categories.
Housing, transportation, and food alone consume 63.3% of the average household’s spending. That concentration is exactly why those three categories deserve the most attention when deciding where to cut. In dollar terms, that’s $26,266 for housing, $13,318 for transportation, and $10,169 for food, out of $78,535 total. Personal insurance and pensions add another $9,797.
Why This Data Is Always a Year or More Old
The Consumer Expenditure Survey takes roughly a year to finalize. The freshest full-year snapshot is always somewhat behind current prices. The 2024 data above wasn’t published until the very end of 2025.
To compensate, layer in more current, category-specific numbers where they exist. August 2026 CPI data shows beef prices up 11.8% year-over-year, while egg prices are actually falling — detail the annual averages simply can’t capture.
Flag which categories are structurally elevated for reasons outside your control. Regional housing costs and your employer’s plan design are good examples. Compare those against categories that reflect discretionary choices, like entertainment or apparel. The former usually calls for a structural fix — refinancing, relocating, switching plans at open enrollment. The latter calls for a habit change.
How Household Costs Have Shifted Since 2020
A few verified data points show real movement since 2020. Average single-coverage health insurance deductibles are up 17% since 2020, per KFF. Food-at-home prices, tracked via the CPI food-at-home index, have climbed a cumulative 27.6% since January 2021.
Those numbers tell a clear story. Even as headline inflation has cooled and reheated across different years, healthcare and grocery costs have moved persistently upward. That reshapes what a “normal” household budget has to absorb, compared to five years ago. It’s one of the personal finance basics worth internalizing. A budget built on 2020-era assumptions about healthcare and groceries is quietly out of date, even if the rest of the plan still holds up.
How to Get Household Costs Under Control
Audit Every Recurring Bill and Subscription
Pull two to three months of actual bank and card statements. Sort every transaction into BLS-style buckets: housing, transportation, food, healthcare, insurance, entertainment, apparel, education, and other. This makes benchmarking against national averages possible, instead of guesswork.
Subscriptions deserve particular attention during this audit. People consistently underestimate how many recurring charges they’re carrying. Treat this as a genuine line-by-line review, not a five-minute skim of your bank app’s homepage. Cancel anything you can’t immediately justify, and note the renewal date for anything you’re keeping.
Negotiate or Shop Fixed Costs Annually
Open enrollment is the most underused opportunity in most households’ financial calendars. Family health premiums rose 6% year-over-year against roughly 4% wage growth, per KFF. Staying on autopilot with the same plan means quietly losing ground every year.
Shop other fixed costs annually too: insurance policies, phone and internet plans, and any service with an introductory rate that’s likely expired. This is one of the simplest personal finance basics to act on. It takes an afternoon, not a lifestyle change.
Right-Size Housing and Transportation Costs
Housing and transportation together make up roughly half the average budget. That’s also where the biggest savings usually live. Recompute your true monthly housing cost — including taxes, insurance, HOA dues, and a maintenance reserve — before deciding whether it’s actually affordable.
Do the same with vehicles. Compare total cost of ownership, not just the loan payment, against your household’s real driving needs. At an average new-vehicle price above $50,000, financing choices alone can shift your monthly transportation cost by hundreds of dollars.
Build Irregular Costs Into a Sinking Fund
Annual and periodic costs — car registration, holiday spending, insurance premiums, home maintenance — are where budgets quietly break down. Divide each one by twelve. Set that amount aside monthly in a dedicated sinking fund, instead of treating it as a surprise.
Revisit the whole budget quarterly, not annually. Category-level inflation has been unusually volatile in 2026, with energy up 16.3% year-over-year even as medical care ticked down 0.2% in a single month. An annual review would miss most of that movement.
Household Cost Mistakes and Red Flags
Underestimating Irregular and Annual Costs
The single most common household budgeting failure is treating irregular costs as “extra,” rather than building them into the monthly plan. A household that budgets only for rent, utilities, and groceries gets blindsided every year by registration fees, insurance renewals, or holiday spending.
The fix is the sinking fund approach above, applied consistently rather than as an occasional patch after a bad month. It’s one of the personal finance basics that sounds obvious. It rarely gets done, though, until after the surprise bill arrives.
Utility and Subscription Billing Scams
Utility impersonation scams are an active, ongoing threat. The FTC warns that scammers threaten same-day shutoffs to create urgency. They then demand payment via wire transfer, cryptocurrency, or gift cards — methods a real utility never requires.
A Kansas City man lost more than $1,000 to exactly this scheme in August 2026, according to local news coverage. Always call the number printed on your actual bill, never a number given to you in the suspicious call or text. Remember: even paid search-engine ads can impersonate real utility companies, so check the organic results too.
Lifestyle Creep After a Raise
Lifestyle creep is the quiet expansion of spending that follows a raise, until the extra income disappears into slightly nicer everything instead of savings or debt payoff. It’s especially easy to miss when premiums and childcare costs are already eating a growing share of every paycheck.
This is part of why the traditional 50/30/20 budgeting rule keeps getting revisited. In high-cost metros, housing and childcare alone can blow past the “50% needs” ceiling. That leaves a raise absorbed by fixed costs before lifestyle creep even enters the picture. Treat every raise as a decision point instead. Direct at least a portion of it straight into savings or debt payoff, before your spending expands to fill the gap.
Junk Fees Hiding in Everyday Bills
Overdraft fees, non-sufficient-funds fees, and credit card late fees have all drawn scrutiny from the Consumer Financial Protection Bureau. The agency has estimated roughly $1 billion a year in potential aggregate consumer savings from NSF fee reforms alone. “Surprise” overdraft fees are a particular target: charges applied even when a customer reasonably believed they had enough funds to cover a purchase.
Some proposed caps have faced legal challenges since 2025, including one that would have cut typical late fees from $32 to $8. Don’t assume every rule is currently enforced. Read your account disclosures directly. Don’t rely on outdated headlines about what’s capped and what isn’t.
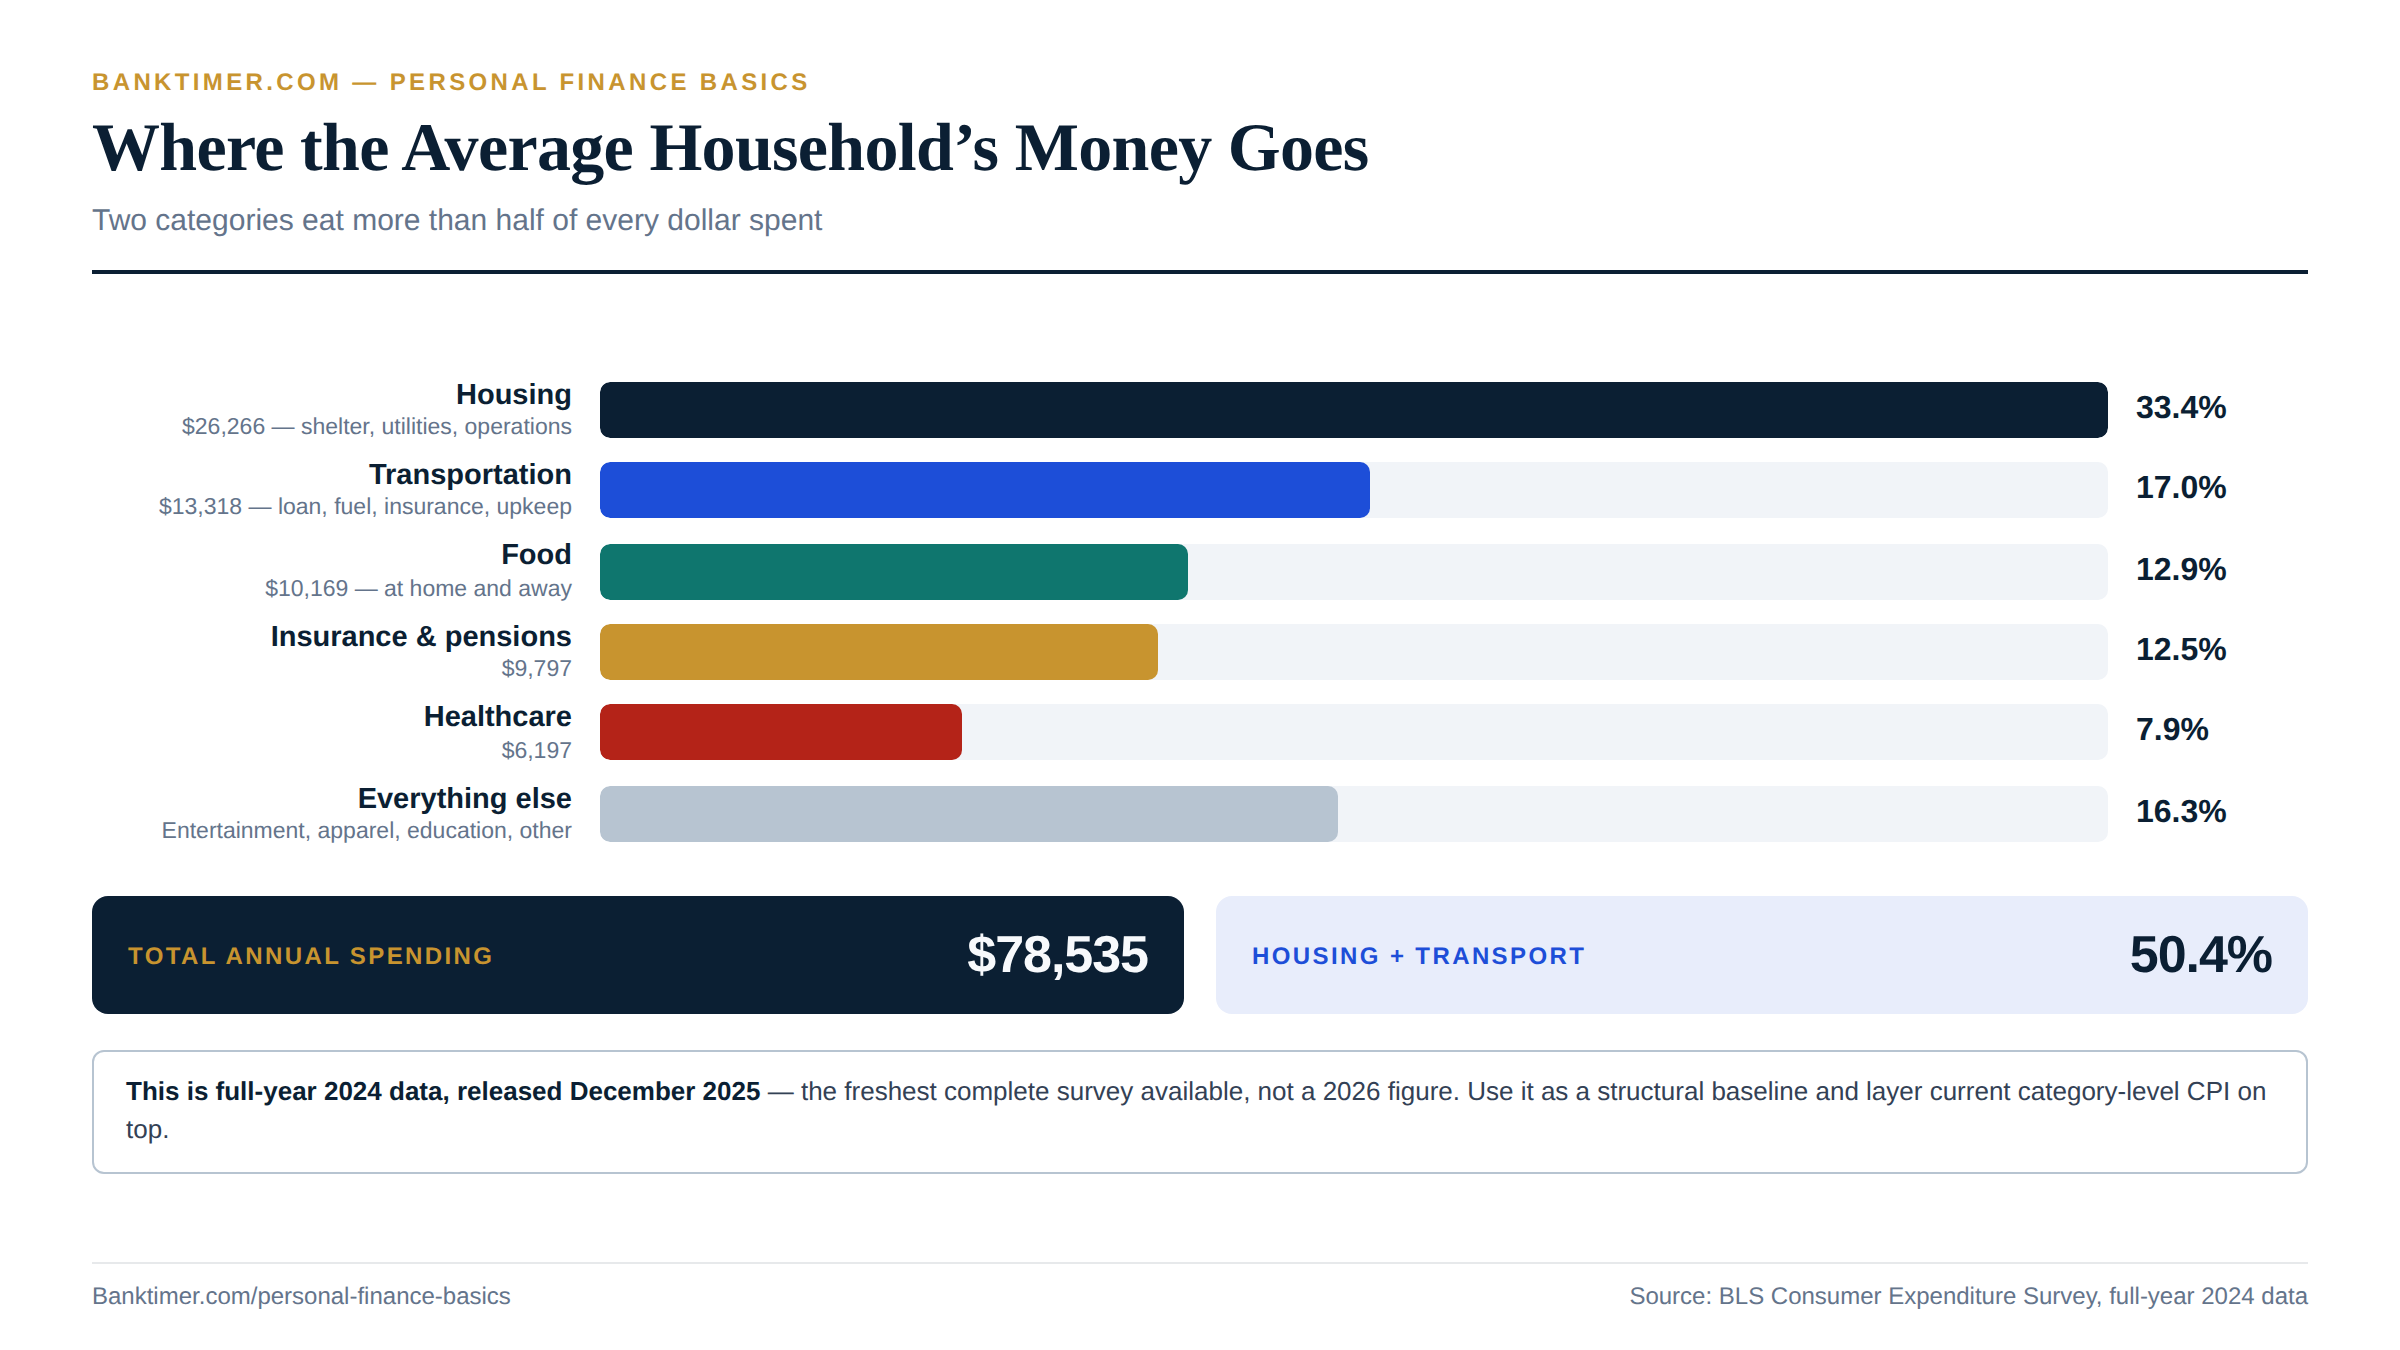
Inflation
Inflation is the mechanism behind almost everything in the two sections above. It’s the reason cost-of-living comparisons keep shifting and household budgets need constant rechecking. Cost of living asks “how much more does this place cost?” Household costs ask “where does the money actually go?” Inflation asks a more basic question: why does the same dollar buy less over time? Answering that well is one of the foundational personal finance basics. It touches savings, wages, and every financial goal you set — and 2026 has been an especially instructive year to learn it.
How Inflation Actually Works
What CPI Measures and How It’s Calculated
The Consumer Price Index tracks how much a fixed basket of goods and services costs over time. The Bureau of Labor Statistics collects those prices monthly across the country. It’s reported as CPI-U, covering about 88% of the population, and CPI-W, a narrower 28% used specifically for Social Security cost-of-living adjustments.
Both indexes use the same underlying price-collection methodology. They simply weight categories differently, to reflect different average spending patterns. That two-index system dates back to a 1974 political compromise. BLS once proposed dropping CPI-W for the broader CPI-U. Labor unions and Congress objected, worried it would lose focus on lower- and middle-income workers. So BLS kept both. Understanding this mechanic is one of those personal finance basics that makes every inflation headline easier to interpret.
Headline Inflation vs. Core Inflation
Core CPI strips out food and energy prices. Those categories swing sharply for reasons unrelated to broad inflation trends — weather, geopolitical energy shocks, that sort of thing. Core CPI is meant to show the more persistent, underlying trend policymakers actually care about.
The Federal Reserve leans even further. It prefers the PCE price index, published by the Bureau of Economic Analysis, over CPI entirely. PCE uses broader weighting that better captures substitution — like consumers shifting from beef to chicken as beef prices climb. It, too, has a “core” version excluding food and energy.
Why the Fed Targets 2%, Not Zero
The Fed’s dual mandate is maximum employment and price stability. It defines price stability as roughly 2% inflation, measured through core PCE. Zero inflation isn’t the goal, because a small, steady rate of price growth gives the economy room to adjust relative prices and wages without forcing outright pay cuts.
That 2% target is also why the September 16, 2026 hike stood out. The Fed judged inflation risk serious enough to raise rates, even with growth described as “solid” and employment holding steady. It was a deliberate, preemptive move, not a reaction to economic weakness. Raising the federal funds rate raises borrowing costs economy-wide. That’s meant to cool demand and take pressure off prices, though the effects typically show up over subsequent months, not immediately.
How Inflation Erodes Savings and Fixed Incomes
Cash sitting in a low-yield account loses real value every month prices rise faster than its interest rate. Fixed incomes are especially exposed. A dollar amount that felt comfortable five years ago buys measurably less today.
Social Security offers some protection through its CPI-W-linked cost-of-living adjustment. That COLA is calculated after the fact, though. It can still lag what retirees actually experience, especially in years with sharp swings like 2026’s. Fixed-income households need to plan for that gap, not assume the COLA fully closes it.
The same logic applies to savings goals stated in flat dollar amounts. A target of “$50,000 saved” set five years ago represents meaningfully less real purchasing power today. The number on the statement, though, hasn’t changed at all.
Where Inflation Stands in 2026
The Latest CPI Reading
August 2026’s CPI-U came in at 3.4% year-over-year, with core CPI at 2.4%, according to BLS data released September 11, 2026. It’s been a genuinely bumpy year: inflation started at 2.4% in January and February, climbed to a 4.2% peak in May — the highest since April 2023 — then eased back to 3.4% by August.
That trajectory matters more than any single monthly snapshot. It shows inflation re-accelerating in 2026, after 2025 ended on a cooling note at 2.7%. That’s exactly the backdrop that pushed the Fed to act.
The Fed’s September 2026 Response
On September 16, 2026, the Federal Reserve raised its federal funds target range by 0.25 points, to 3.75%–4.00%. It was the Fed’s first hike since 2023, decided unanimously, 12-0. The FOMC statement described the economy as “expanding at a solid pace” with job gains keeping pace, but called inflation “elevated.”
Fed Governor Kevin Warsh reportedly told reporters afterward that inflation is “still too high,” even with the hike already in place, according to CNBC’s coverage. For borrowers, this means new mortgages and auto loans get somewhat more expensive at the margin. Variable-rate debt reprices too, going into the fall.
The Committee also flagged uncertainty from geopolitical developments in its statement. That’s a reminder this decision wasn’t made lightly. Don’t expect a single hike to visibly cool CPI within a few weeks. Rate policy works with long, variable lags.
Which Categories Are Running Hottest
The headline number hides enormous category-level dispersion. Energy prices rose 16.3% year-over-year in August 2026, with gasoline accounting for over a third of that month’s entire all-items increase, per BLS. Airline fares climbed even faster, up 23.4% year-over-year.
Regionally, the Northeast ran hottest at 3.9% annual inflation. The South came in at 3.1%, the West at 3.2%, and the Midwest at 3.6% — a meaningful 0.8-point gap between the highest and lowest regions. Budgeting off the national 3.4% figure without checking your own region misses a lot of the real picture.
Not every category is running hot, either. Motor vehicle insurance actually fell 0.8% month-over-month. Medical care dipped 0.2%, and used cars and trucks ticked up just 0.4%. “Inflation is elevated” doesn’t mean every price is climbing at once. New vehicles, notably, hadn’t shown much tariff-driven price movement by mid-2026. That’s despite announced tariffs on auto parts — a trend worth watching.
The Gap Between Wage Growth and Prices
The Fed’s preferred PCE gauge rose 3.7% year-over-year in July 2026. Specific cost categories are outpacing typical wage growth by a wide margin. Health insurance premiums, for instance, rose 6% year-over-year against roughly 4% wage growth, per KFF.
That gap is where real financial pressure builds, even when a paycheck technically grows every year. A raise can trail the categories a household actually spends the most on: housing, healthcare, energy. That household can still end up worse off in practical terms.
How to Protect Your Money From Inflation
Keep Cash Savings in Inflation-Beating Accounts
With CPI running at 3.4%, cash parked in a near-zero traditional savings account is quietly losing purchasing power every month. Shop rates actively. The Fed’s September hike tends to lift deposit rates at some banks and credit unions before it fully reaches loan rates.
Comparing accounts every few months beats settling in once and forgetting about it. It’s one of the simplest personal finance basics, and it consistently pays for itself over a full year.
Use I Bonds for Inflation-Protected Savings
Series I savings bonds, purchased directly through TreasuryDirect, combine a fixed rate with an inflation rate that resets every May and November based on CPI-U changes. That structure gives savers a return that tracks inflation almost by design, rather than hoping a fixed-rate account keeps up.
The tradeoffs matter, though. You can’t cash an I bond in the first 12 months. Redeeming one before five years costs three months of interest as a penalty. They work best for money you’re genuinely willing to set aside for a few years, not an emergency fund. Electronic purchases through TreasuryDirect are capped at $10,000 per person, per calendar year. I bonds work best as one piece of an inflation-protection strategy, not the whole plan.
Revisit Fixed-Dollar Budgets and Goals Regularly
A savings goal set in dollar terms — “save $500 a month toward a down payment” — quietly loses relevance as prices shift underneath it. Inflation hit different categories very unevenly in 2026, from 16.3% energy growth to essentially flat medical costs. A goal set even six months ago may need adjusting.
Revisit fixed-dollar goals at least quarterly, the same discipline that applies to household budgets. Treating a savings target as permanent, instead of repricing it periodically, is one of the more overlooked personal finance basics in long-term planning.
Negotiate Income to Keep Pace With Prices
When negotiating a raise or a lease renewal, use the most recent one-to-three-month inflation trend, not a single year-old figure. 2026 has shown how fast that trend can move — from 2.4% to 4.2% and back to 3.4% within months.
Weight the conversation toward your own spending categories, too. A renter with a car and a grocery-heavy budget has faced a different inflation reality this year than a homeowner with a paid-off vehicle. That distinction is worth making explicitly when asking for more pay.
Inflation Mistakes and Misconceptions
Confusing a Falling Inflation Rate With Falling Prices
When CPI cooled from a 4.2% peak in May 2026 to 3.4% in August, prices didn’t fall. They simply rose more slowly. This is disinflation, not deflation, and confusing the two leads people to expect price relief that isn’t coming.
Grocery bills, rent, and gas prices from a year ago are still the baseline. A slowing inflation rate just means the climb from here is gentler than it was a few months earlier — not a reversal. This is one of the personal finance basics that’s easy to state correctly and still get wrong in practice. Headlines often call a lower number “good news,” without explaining what it actually means for your grocery bill.
Ignoring Inflation When Setting Long-Term Goals
2026 is a clean example of why extrapolating from a single month is risky. Inflation moved from 2.4% in February to a 4.2% peak in May, then back down to 3.4% by August. Anyone planning off any one of those points alone would have been wrong more than once this year.
Long-term goals — retirement contributions, education savings, a house down payment — need to assume inflation keeps moving unpredictably. Don’t settle into whatever the most recent headline happened to say.
“Inflation-Proof” Investment Scams
Periods of headline-making inflation, like 2026’s, reliably attract “inflation-proof” and “beat inflation” sales pitches. Precious-metals high-pressure sales, unregistered “inflation hedge” schemes, and crypto pitches marketed around inflation fear are classic vectors for real financial harm.
Before moving money into anything pitched as an inflation hedge, verify the seller’s registration status through FINRA BrokerCheck or your state securities regulator. No product legitimately guarantees it will outrun inflation. Any pitch claiming otherwise deserves real skepticism. Price-gouging and shrinkflation complaints also tend to spike alongside acute inflation news. That’s exactly why state attorneys general routinely issue consumer warnings during periods like this one.
Why Nominal Gains Can Still Be Real Losses
Tariffs contributed an estimated 0.2 to 0.4 percentage points to core PCE inflation as of July 2026. That’s meaningful, but not the whole story — core PCE would still run roughly a full point above the Fed’s 2% target even without any tariff effect at all.
That distinction matters for judging your own “gains.” A raise, an investment return, or a COLA can look positive in nominal dollars. It can still represent a real loss, once you subtract the inflation rate actually eating into it. Nominal numbers without that adjustment are, at best, half the picture. Treating them as the whole picture is one of the costliest personal finance basics to get backward.
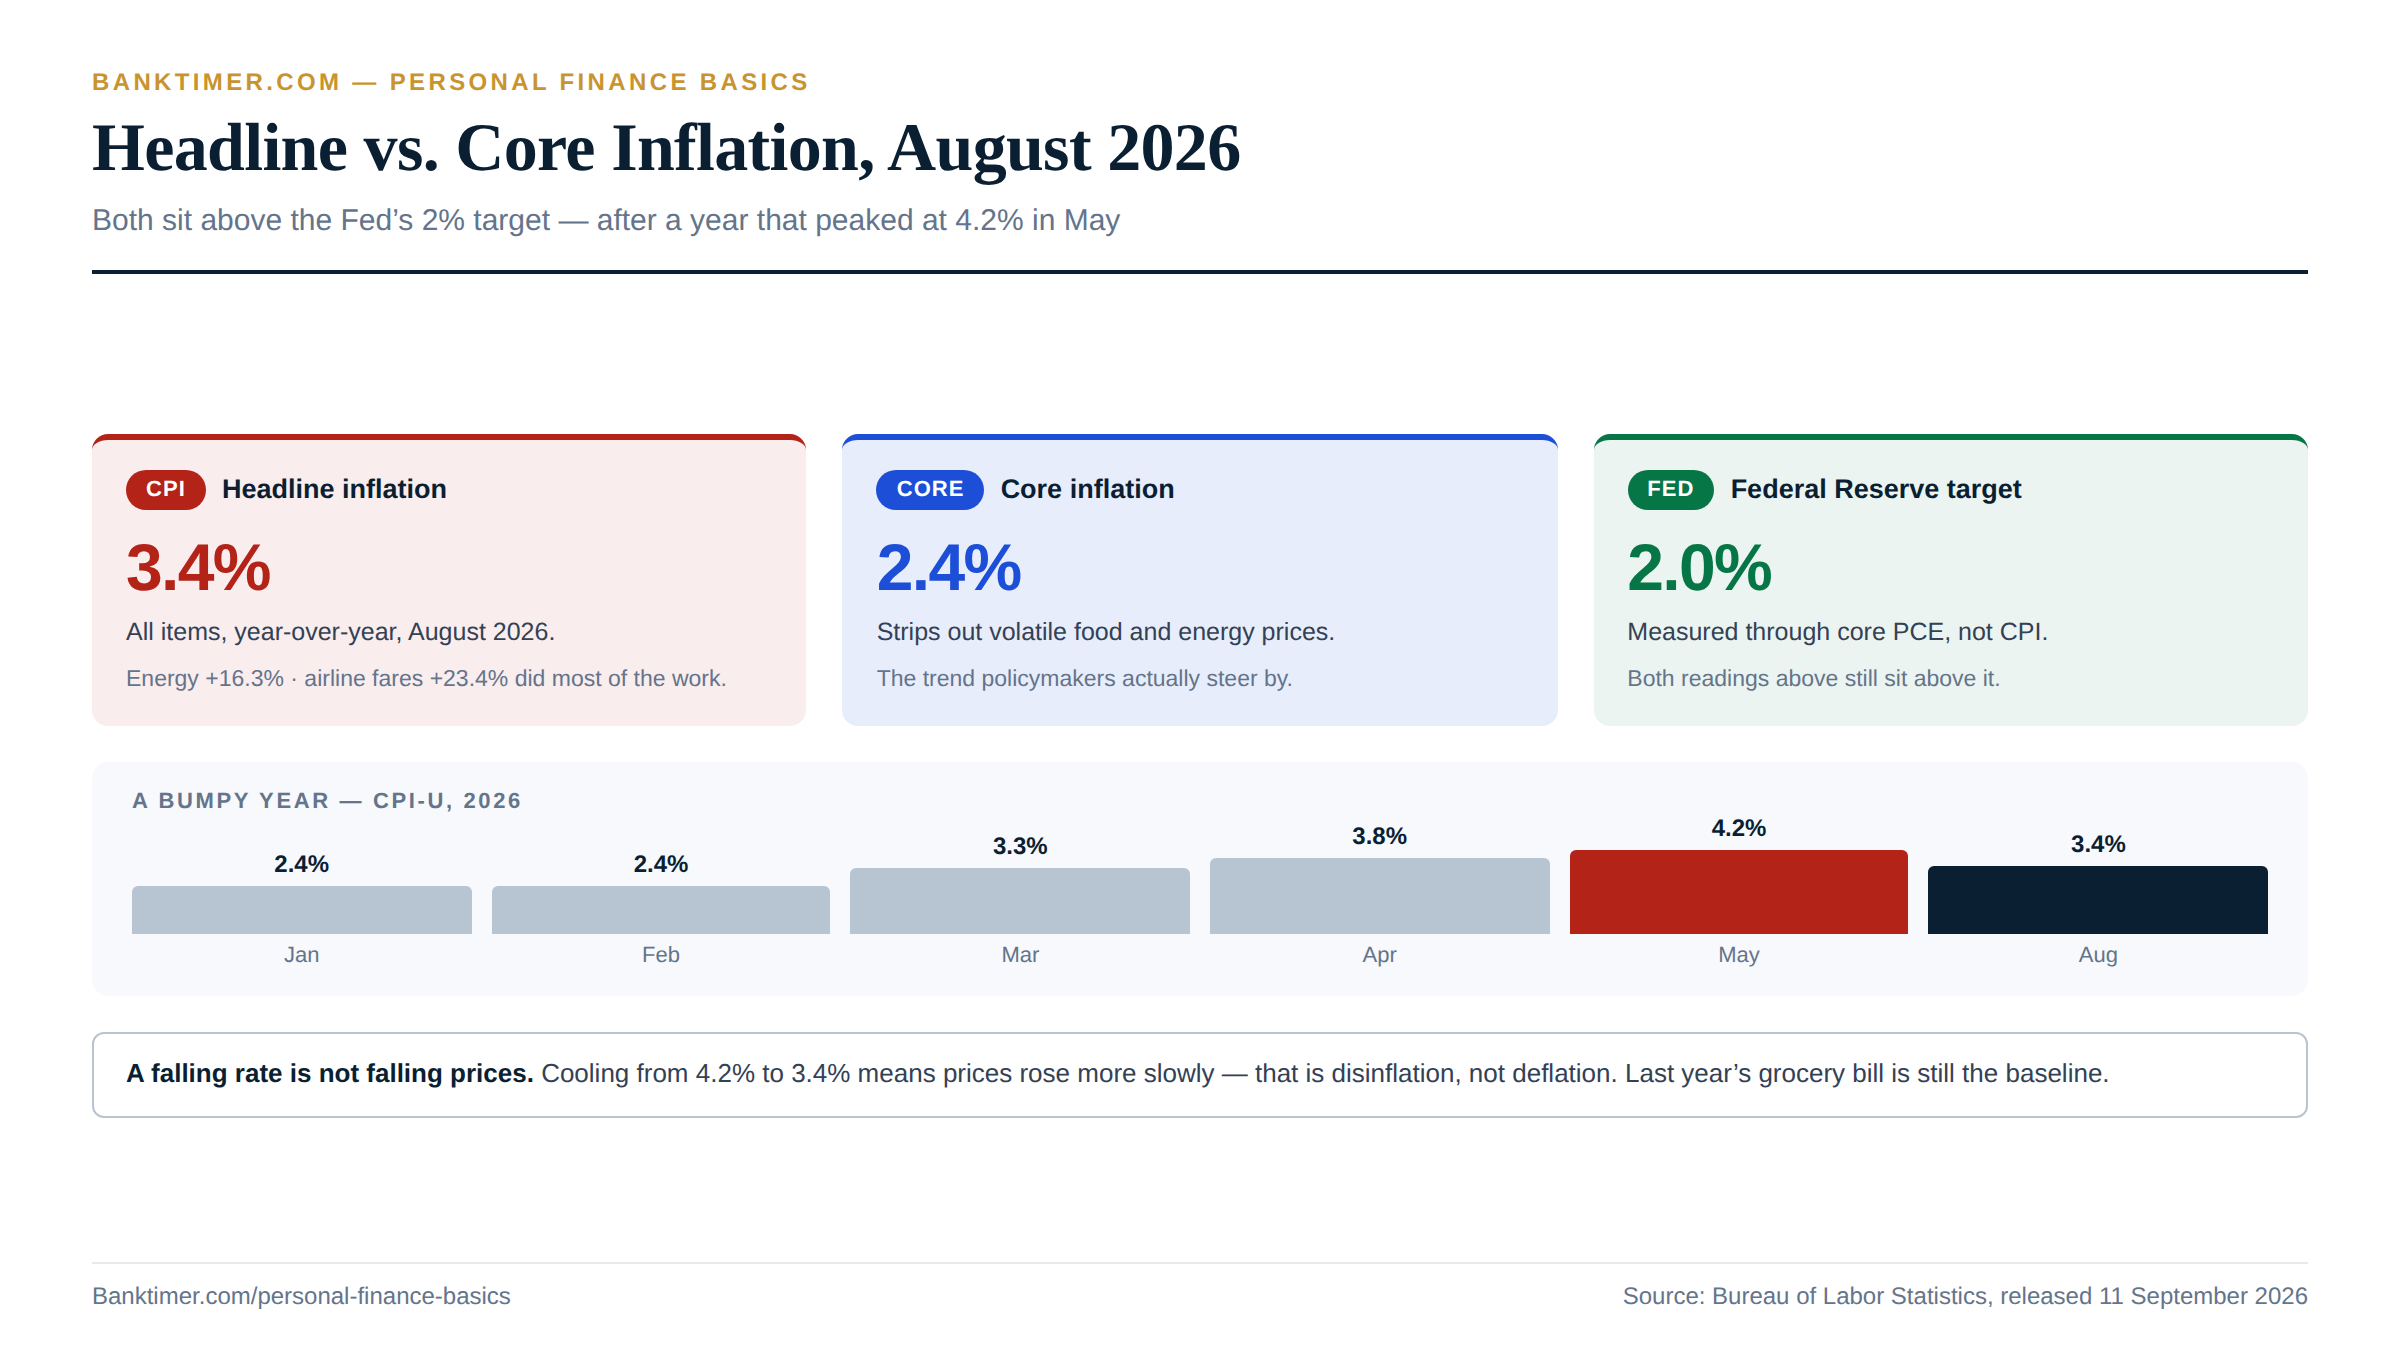
Net Worth
If debt tells you what you owe, net worth tells you where you actually stand. It’s the scorecard that ties together every other decision in this guide — how much you save, how much you borrow, and how those choices compound over time. Among all the personal finance basics, net worth is the one number that captures the whole picture in a single figure. But as you’ll see in this section, the official data behind that number has a real blind spot most sites never mention.
What Net Worth Actually Measures
The Simple Formula Behind a Complicated Number
The formula itself is refreshingly simple: net worth equals total assets minus total liabilities, measured at one point in time. It’s a financial snapshot, not a flow like income, which is exactly why it can look so different from what your paycheck suggests.
If liabilities exceed assets, net worth comes out negative. That’s common, and it’s not catastrophic. A recent graduate with student loans and few assets yet is the textbook example: a negative number here doesn’t mean failure, it means the balance sheet hasn’t caught up to the earning years still ahead.
What Counts as an Asset (and What Doesn’t)
On the asset side, count cash and cash-equivalents (checking, savings, money market), investment and retirement accounts (brokerage, 401(k), IRA), real estate at current market value, vehicles at current resale value, and any business ownership stake. On the liability side, count every mortgage, auto loan, student loan, credit card balance, personal loan, and medical debt you owe.
Two practical rules keep the math honest. Value depreciating or illiquid assets conservatively — a car’s realistic trade-in value, not what you paid for it. And don’t double-count a financed home: it contributes its equity (market value minus the remaining mortgage balance), not its full market value.
Why Net Worth and Income Aren’t the Same Thing
A high income and a high net worth are not the same achievement, and confusing the two is one of the more common personal finance basics people get wrong. A big earner who spends everything — or carries heavy credit card debt — can end up with a lower, even negative, net worth than someone earning far less who saves and invests consistently.
That’s because income is a flow, measured month to month, while net worth is a stock built up over years of saving, investing, paying down debt, and watching assets appreciate. One good year of income doesn’t fix a decade of spending it all.
Median vs. Average, and Why the Gap Is Huge
Average, or mean, net worth gets pulled sharply upward by a relatively small number of very wealthy households. Median net worth — the household exactly in the middle — is the more honest picture of a typical American family’s finances.
The gap between the two is enormous. Per the Fed’s 2022 Survey of Consumer Finances — 2022 data, the most recent published wave, released October 2023 — mean family net worth was $1,063,700, while median net worth was $192,900, roughly a 5.5-times gap. Whenever you see a single “average net worth” headline, ask whether it’s actually the median, because the two numbers tell very different stories.
The Data Problem Nobody Mentions
The Last Real Net Worth Data Is From 2022
Here’s something almost no other site will tell you plainly: every “net worth in 2026” table you’ve seen is actually built on 2022 data. The Fed’s Survey of Consumer Finances (SCF) is the only U.S. source detailed enough to break net worth down by age, income, and education using real household surveys — but it only runs every three years, and its fieldwork happened in 2022.
Those results, “Changes in U.S. Family Finances from 2019 to 2022,” weren’t published until October 2023. The next wave was fielded from March through December 2025, but as of this writing in September 2026, the Fed still hasn’t released it. Based on the roughly 10-month lag after the 2022 fieldwork, a release sometime in late 2026 or 2027 is plausible, but nothing is confirmed yet.
This isn’t a niche detail. Major finance sites publishing “2026 net worth by age” tables right now — the kind you’ll find on NerdWallet, Fidelity, Kiplinger, and similar outlets — are, without exception, still built on that same 2022 wave. If a headline claims fresher household-survey data than that, treat it as mislabeled rather than as some scoop the rest of the industry missed.
Net Worth by Age, Officially Dated
With that caveat firmly in place, here’s what the 2022 SCF — again, 2022 data, released October 2023, the most recent wave available — shows for median net worth by age of household head:
- Under 35: $39,000 (up 143% from $16,100 in 2019)
- 35-44: $135,600
- 45-54: $247,200
- 55-64: $364,500
- 65-74: $409,900 (the peak bracket)
- 75+: $335,600
Every bracket rose sharply from 2019, largely reflecting pandemic-era stimulus, a hot 2021-22 housing market, and elevated savings rates during that period. Treat these figures as a historical benchmark, not a live read on where households stand today.
The Quarterly Substitute, and Its Limits
The Fed does publish something more current: the Distributional Financial Accounts (DFA), updated quarterly, most recently as of June 2026. It shows how wealth shares split across percentile groups — the top 0.1%, the next 0.9%, and so on — by age, education, income, and race.
But there’s a real limit here, worth stating plainly: the DFA isn’t a new independent survey of actual households. It’s a model that takes the last real SCF wave’s detail and interpolates it forward using aggregate quarterly financial data. That makes it a useful directional signal — you can see how the top 10%’s wealth share has moved with the stock market since 2022 — but it isn’t fresh, ground-truth data the way an actual survey wave is.
Rule-of-Thumb Targets to Use in the Meantime
Given the vintage problem above, many readers find rule-of-thumb targets more useful than a stale government benchmark for day-to-day planning. A commonly cited industry guideline — not a federal statistic, just a widely used financial-planning heuristic — suggests having roughly 1 times your annual salary saved in retirement accounts by age 30, 3 times by 40, 6 times by 50, 8 times by 60, and 10 times by 67.
These vary slightly by source, so treat them as a general compass rather than a strict pass/fail test. The point isn’t to hit an exact multiple; it’s to have some forward-looking target that doesn’t depend on data that’s already years old by the time you read it. That patience-over-precision mindset is one of the quieter personal finance basics worth internalizing early.
How to Calculate Your Own Net Worth
Inventory Every Asset Honestly
Start with cash accounts at face value, then move to investment and retirement accounts at their current statement value — that part’s easy since the numbers are right there. Real estate is where people get sloppy: use a realistic current estimate, like a recent appraisal, a comparative market analysis from an agent, or a conservative automated valuation, not the price you paid or an optimistic guess.
Vehicles get the same conservative treatment: use current private-party or trade-in value, not what you originally paid. This is one of those personal finance basics where honesty with yourself matters more than precision to the dollar.
Inventory Every Liability, Including the Awkward Ones
Liabilities require the same discipline — list every mortgage, HELOC, auto loan, student loan, credit card balance, personal loan, and medical debt at its current payoff balance, not what you originally borrowed. A mortgage you took out for $350,000 ten years ago might have a $280,000 payoff balance today; use the $280,000.
Don’t skip the awkward ones. Money owed to family or friends, medical bills sitting in collections, and a tax bill you know is coming all count. Leaving them off doesn’t make them disappear; it just makes your net worth number falsely optimistic.
Calculate on a Fixed Schedule, Not Daily
Once you’ve got assets and liabilities listed, the math is one subtraction: assets minus liabilities. The harder discipline is deciding how often to redo it. Quarterly is the common convention, for good reason — frequent enough to catch real progress, but infrequent enough that you’re not reacting to every daily swing in a brokerage or retirement account balance.
Net worth is meant to be a slow-moving trend line, not a daily scoreboard. Checking it every day just invites anxiety over market noise that has nothing to do with your actual financial progress.
Track the Trend, Not the Snapshot
A single net worth number means very little on its own. Without context — your age, income, region, and family situation — comparing yourself to a national figure can be misleading, and as you now know, that figure might already be years out of date.
The trend matters far more than any single snapshot. Is your net worth consistently rising as you pay down debt and grow savings and investments? That direction of travel, tracked quarter after quarter, is a far more useful gauge of your personal finance basics than a one-time comparison to a stale median.
Net Worth Mistakes and Misconceptions
Forgetting Liabilities That Don’t Feel Like Debt
The single most common net worth mistake is quietly forgetting liabilities that don’t feel like “real” debt. A loan from your parents, a medical bill sitting in collections, or taxes you know you’ll owe next April don’t show up on a credit report the way a credit card does, so people leave them off entirely.
The effect is always the same: an artificially inflated net worth that doesn’t reflect reality. If you’d be embarrassed to mention a debt out loud, that’s usually a sign it belongs on the liabilities side of your ledger, not a reason to skip it.
Overvaluing a Home or a Car
Homes and cars are the two assets people most reliably overvalue. Using an optimistic automated home-value estimate instead of a conservative one, or valuing a car at its original purchase price instead of what it would actually sell for today, both inflate net worth on paper without reflecting real, spendable wealth.
The bigger error is treating a home’s full market value as available wealth without subtracting what’s still owed on the mortgage. A $450,000 house with a $300,000 mortgage balance contributes $150,000 to net worth, not $450,000. Skipping that subtraction is an easy way to overstate your financial position by a lot.
“Wealth Secret” Scams That Target Net Worth Anxiety
Anxiety about a low net worth number makes people vulnerable to a very specific scam pattern: self-styled “wealth coaches” selling a proprietary system or secret formula to rapidly multiply your net worth, usually through a high-pressure seminar or an expensive course. A legitimate fee-only fiduciary or registered investment adviser doesn’t need to charge you thousands upfront for a “system,” and no one can guarantee investment returns.
Watch for the same red flags that show up across every financial scam: promises of guaranteed high returns, pressure to act immediately, requests to move your money onto an unfamiliar platform, and reluctance to share verifiable licensing information. You can check any adviser’s credentials yourself through FINRA BrokerCheck or the SEC’s Investment Adviser Public Disclosure database before sending a dollar.
Why a Rising Number Can Still Be a Real Decline
A rising net worth number can still represent a real decline once you account for inflation. With August 2026 inflation running at 3.4% annually, a net worth that grew 2% in nominal dollars actually lost purchasing power, and none of the 2022 SCF figures above are adjusted for that.
The September 16, 2026 rate hike adds another wrinkle on the asset side. It pushed the 10-year Treasury yield above 5% and mortgage rates to a one-year high, which tends to cool housing demand and can pressure home valuations — a major component of net worth for most middle-class households. Higher rates also raise the bar equity valuations have to clear, a headwind worth watching even without predicting where markets go next.
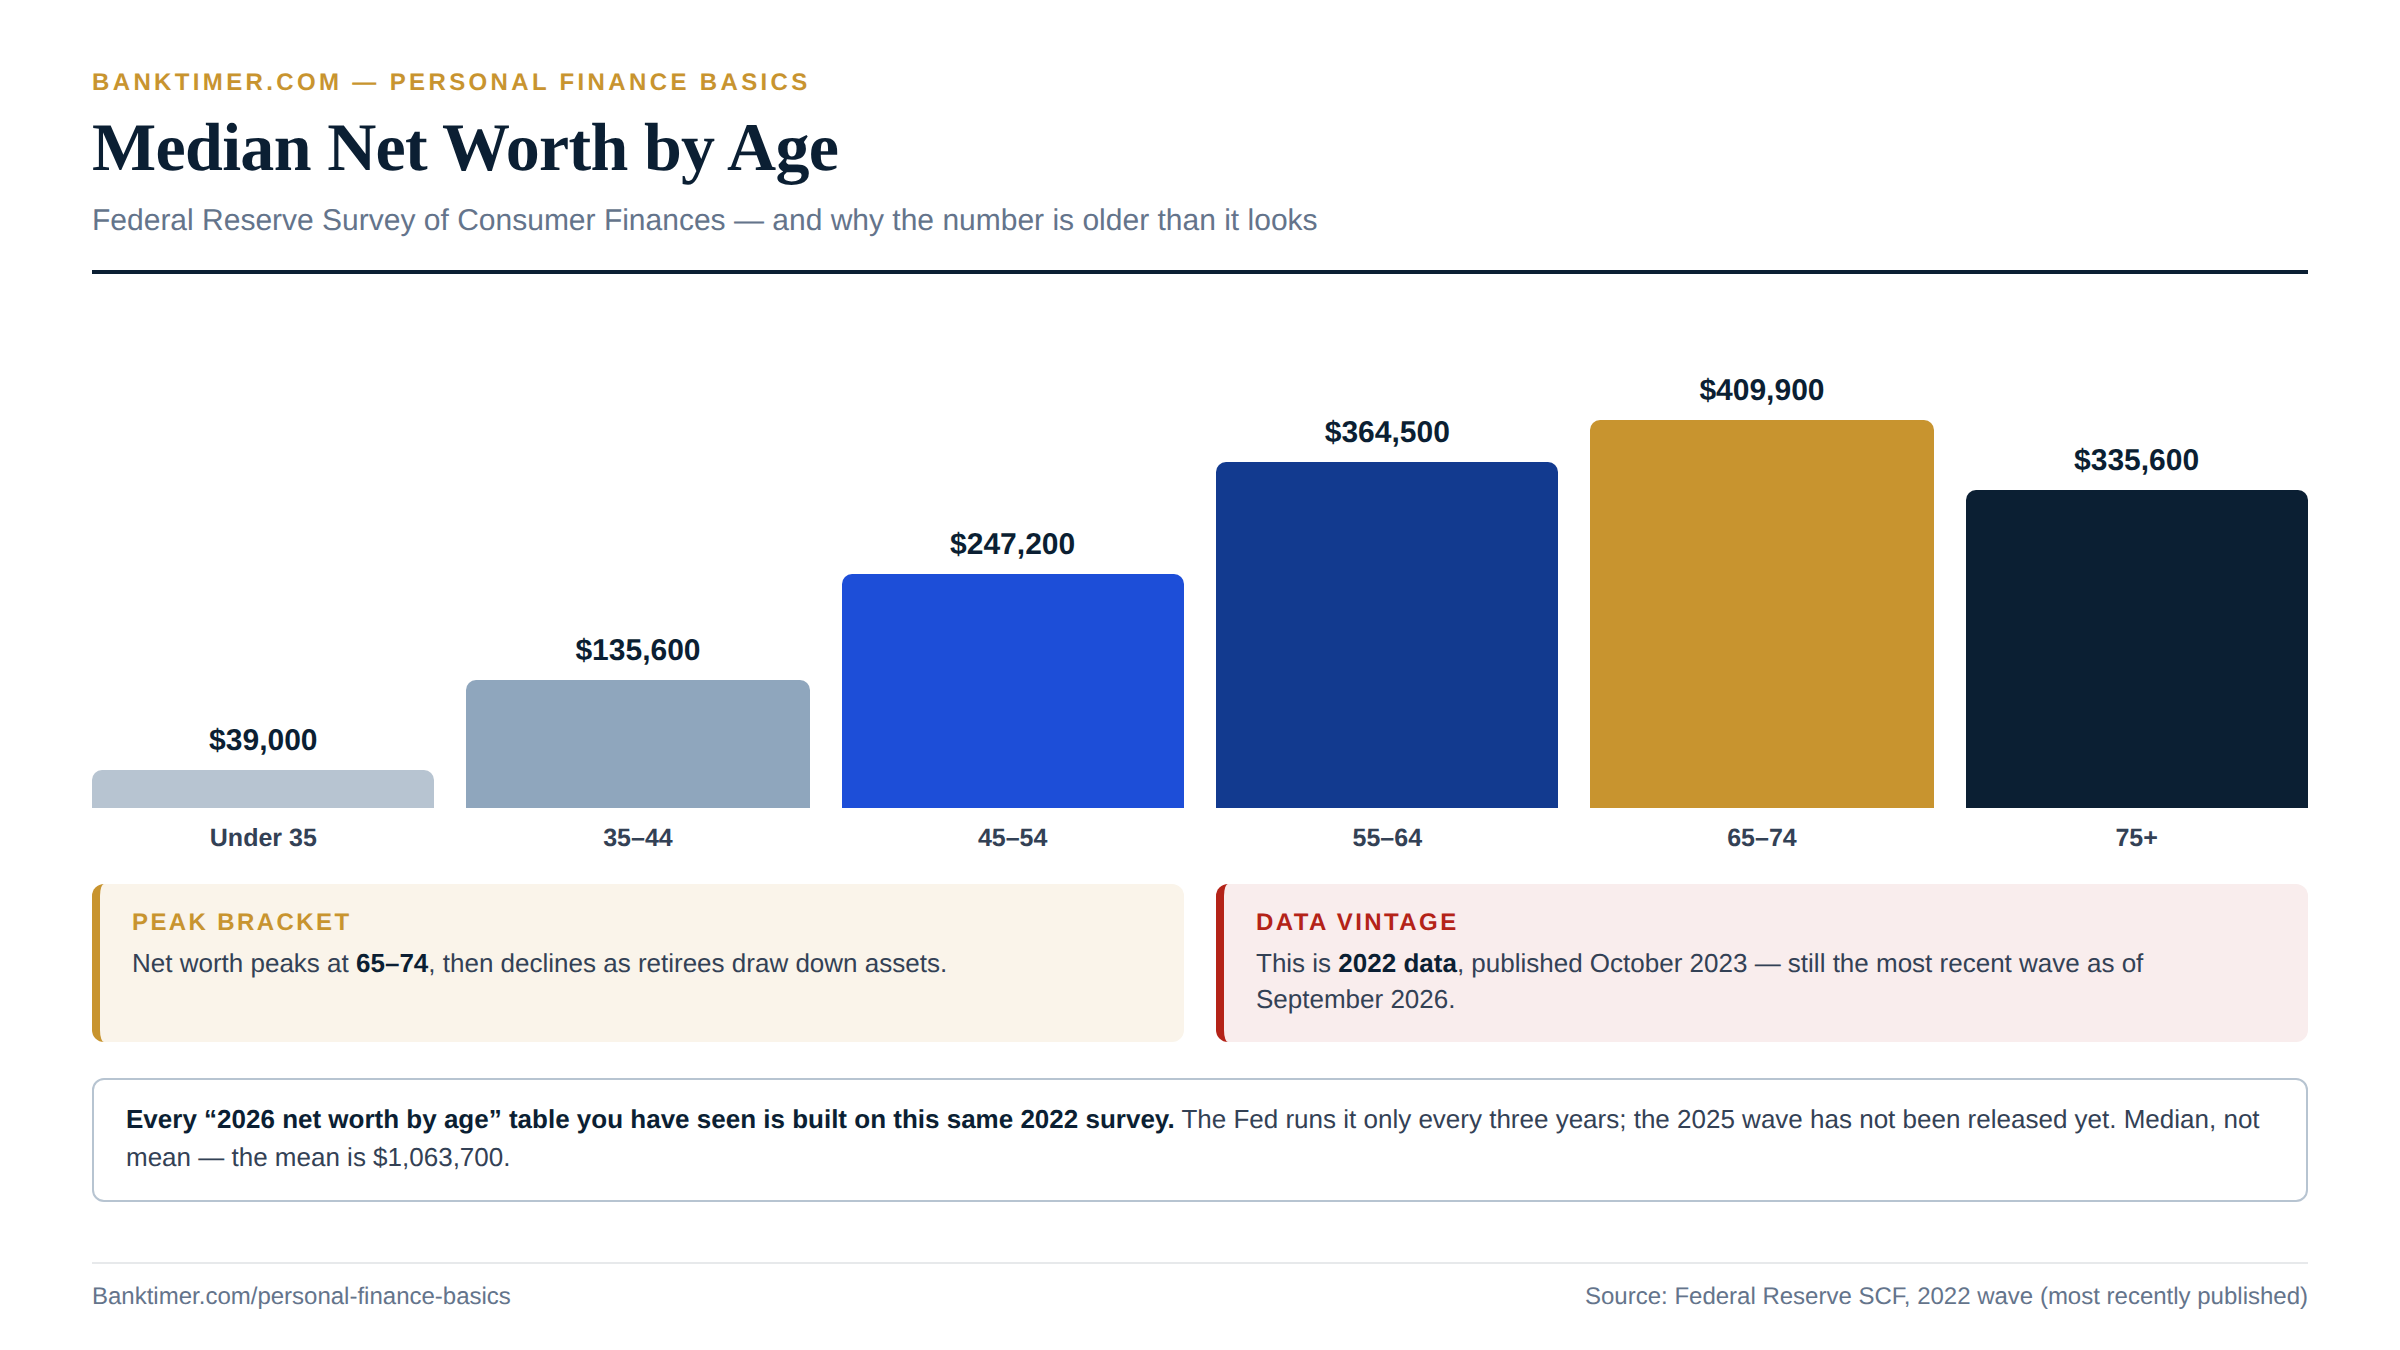
Retirement Planning
Retirement planning turns today’s paycheck into tomorrow’s income, and it’s arguably the personal finance basics topic with the most moving parts — employer plans, tax rules, and contribution limits that change every year. Get the fundamentals right early, and compound growth, covered in the previous section, does most of the heavy lifting for you. Here’s what actually matters for 2026, from account types to the newest SECURE 2.0 rules.
The Building Blocks of Retirement Planning
401(k), 403(b), and Employer Plans Explained
A 401(k) — or its cousins, the 403(b) for nonprofit and school employees, and the 457(b) or TSP for government workers — is a payroll-deduction retirement plan sponsored by your employer. You choose a percentage or dollar amount to defer from each paycheck, either pretax (traditional) or after-tax (Roth), and it grows without annual tax drag until you withdraw it.
More than 85% of 401(k) plans serviced by Fidelity include some employer contribution, whether a match, profit-sharing, or both. These plans are the backbone of most Americans’ retirement savings, precisely because the payroll deduction happens automatically, before you ever see the money.
Traditional vs. Roth: The Tax-Timing Decision
The Traditional-versus-Roth choice comes down entirely to timing. Traditional accounts give you a tax break today and tax the withdrawals later; Roth accounts skip today’s tax break but let qualified withdrawals — including all the growth — come out completely tax-free.
The classic rule of thumb: if you expect a lower tax bracket in retirement than you’re in now, favor Traditional. If you expect the same or a higher bracket later, common for early-career savers, favor Roth. Many advisors recommend holding both types for “tax diversification,” a hedge against guessing future tax rates wrong. Getting this call right is one of the more consequential personal finance basics decisions you’ll make in your twenties or thirties.
Employer Matches and Why They’re “Free Money”
The most common employer match formula, per Fidelity’s own plan data, is 100% of your first 3% of pay deferred, plus 50% of the next 2% — meaning a 5% employee contribution nets a 4% employer match, or 9% of pay saved in total. Average total employer contributions run about 4.8% of pay, though it varies by generation, from 4.0% for Gen Z up to 5.2% for Gen X.
Employer contributions typically vest over time, sometimes up to six years under IRS rules, whether through “graded” vesting (a percentage each year) or “cliff” vesting (all at once after a set number of years). Your own contributions, by contrast, are always 100% vested immediately — it’s only the employer’s money that carries a waiting period. Leave a job before that money vests, and you forfeit whatever hasn’t cleared yet, which is worth checking before you hand in notice.
Social Security’s Role in the Bigger Picture
Social Security is a separate, government-run system funded by payroll taxes, meant to supplement personal savings, not replace them. For 2026, the average monthly retired-worker benefit rises to $2,071, and an aged couple both receiving benefits averages $3,208 combined, following the Social Security Administration’s 2.8% cost-of-living adjustment.
The maximum possible benefit at full retirement age is $4,152 a month. Even at the maximum, that’s rarely enough to fund a comfortable retirement alone — exactly why the 401(k)s, IRAs, and other tools in this section matter so much. Worth noting: the wage base subject to Social Security payroll tax also rises, to $184,500 for 2026, so higher earners contribute (and eventually accrue benefit credit) on more of their income than in prior years.
Retirement Numbers to Know for 2026
2026 Contribution Limits for 401(k)s and IRAs
The employee deferral limit for 401(k), 403(b), 457, and TSP plans rises to $24,500 for 2026, up from $23,500 in 2025, according to the IRS. Traditional and Roth IRA limits rise to $7,500, up from $7,000, and the combined employee-plus-employer “annual additions” ceiling for 401(k)-type plans reaches $72,000.
If you’re self-employed, SEP-IRAs and Solo 401(k)s allow much higher tax-advantaged savings than a regular IRA — worth exploring if a W-2 job isn’t in the picture. These numbers rise most years with inflation, so check them every January.
Small-business employees have their own version of these numbers, too: the SIMPLE IRA limit rises to $17,000 for 2026 (catch-up: $4,000, for a $21,000 total), with an “enhanced” limit of $18,100 available at employers that elect the higher SECURE 2.0 tier. It’s a smaller ceiling than a 401(k), but still a meaningful jump from a standard IRA’s $7,500 cap.
Catch-Up Contributions After Age 50
Once you turn 50, you can contribute an extra $8,000 to a 401(k)-type plan, bringing your total to $32,500 for 2026. IRAs get a smaller catch-up: an additional $1,100, for a total of $8,600.
SECURE 2.0 also created a “super” catch-up just for ages 60 through 63: an extra $11,250, pushing the 401(k) total to $35,750 for that four-year window. That’s a meaningful head start for anyone who got a late start on saving, and it makes sense to steer bigger contribution years toward this specific age band if your budget allows it.
These catch-up amounts also raise the ceiling on the combined employee-plus-employer limit discussed above: the standard $72,000 annual-additions cap becomes $80,000 for anyone using the regular 50-plus catch-up, and $83,250 for the 60–63 super catch-up window. Very few people max out an employer plan on their own, but it’s useful to know how high the ceiling actually goes.
SECURE 2.0 Changes Phasing in for 2026
Several SECURE 2.0 provisions are live or newly active this year. Any new 401(k) or 403(b) plan established after December 29, 2022 must now automatically enroll eligible employees at a default deferral rate between 3% and 10%, with mandatory 1%-a-year auto-escalation up to at least 10%.
Separately, the Required Minimum Distribution age is still phasing upward — 73 for those born 1951–1959, rising to 75 for those born in 1960 or later. The Qualified Charitable Distribution limit also climbs, to $111,000 for 2026, up from $108,000. Together, these changes nudge more workers into saving automatically and give retirees more flexibility later.
How Far Behind Are Most Americans, Really?
It’s worth being honest about where most people actually stand. The Federal Reserve’s Survey of Consumer Finances — 2022 data, the most recent published wave — remains the best national snapshot of household net worth by age, though the picture has certainly shifted in the years since.
Separately, a 2025 industry report from Capitalize, cited via Fidelity, found Americans have left behind 32 million forgotten 401(k) accounts holding a combined $2.1 trillion. That’s not a reason for panic — it’s a reason to check whether any of that money is yours.
A Step-by-Step Approach to Retirement Planning
Capture the Full Employer Match First
Before you do anything else with extra savings, contribute enough to your 401(k) to capture the entire employer match. It’s an immediate, guaranteed return that no stock, bond, or savings account can promise you.
Advisors commonly recommend this exact sequence: match first, then max an IRA — Roth if you’re eligible, otherwise Traditional or a backdoor Roth — and only then return to your 401(k) to push toward the $24,500 limit. Skipping straight to an IRA before capturing your match leaves free money on the table for no good reason.
Decide Between Traditional and Roth Based on Your Bracket
Look at your current marginal tax bracket and make an honest guess about your bracket in retirement. Early-career savers in lower brackets now often come out ahead with Roth contributions, paying tax today at a low rate and never again. High earners in peak income years often benefit more from Traditional contributions, deducting now and deferring tax to a likely-lower-bracket retirement.
High earners above Roth income limits can still use a “backdoor Roth” — contributing to a nondeductible Traditional IRA, then converting it — though the pro-rata rule can complicate things if you hold other pretax IRA money elsewhere. For 2026, the Roth IRA contribution phases out between $153,000 and $168,000 of modified adjusted gross income for single filers, and between $242,000 and $252,000 for married couples filing jointly, per Vanguard’s income-limit summary — which is exactly the population the backdoor strategy exists for.
Increase Contributions With Every Raise
One of the simplest personal finance basics for retirement is this: every time your pay goes up, increase your contribution percentage before you get used to the extra cash. Even a single extra percentage point a year compounds meaningfully over a career.
If your plan allows after-tax contributions beyond the standard $24,500 deferral limit, up to the full $72,000 combined cap, a “mega backdoor Roth” lets high earners funnel far more than $7,500 a year into Roth-style accounts — a strategy worth asking your plan administrator about directly.
Revisit Your Asset Allocation as You Age
Your mix of stocks and bonds should shift gradually as retirement gets closer, trading some growth potential for stability. Target-date funds handle this automatically and are now the default option in most employer plans.
It’s also worth remembering that an HSA can double as a stealth retirement account after age 65, when funds can be withdrawn for any purpose without penalty, though non-medical withdrawals are then taxed as income. For 2026, HSA limits reach $4,400 for self-only coverage and $8,750 for family coverage, plus a $1,000 catch-up at age 55 and older.
Retirement Planning Mistakes and 2026 Changes
Leaving Employer Match Money on the Table
This remains the single most common — and most avoidable — retirement mistake. If your employer matches 50% of contributions up to 5% of pay and you’re only deferring 2%, you’re forfeiting real compensation every pay period, not just a hypothetical future benefit.
Set your contribution rate to at least match your employer’s formula the same week you’re eligible, if you can. There’s no equivalent guaranteed return anywhere else in personal finance basics, and no amount of catching up later fully makes up for years of missed matching.
Cashing Out a 401(k) When Changing Jobs
Cashing out a 401(k) when you leave a job feels tempting, especially if the balance looks small, but it triggers ordinary income tax plus a 10% early-withdrawal penalty if you’re under 59½. Rolling the balance into your new employer’s plan or an IRA avoids both.
This mistake compounds at a national scale, too — that same Capitalize/Fidelity report found 32 million forgotten accounts worth $2.1 trillion sitting with former employers. Before starting a new job, take fifteen minutes to roll over the old one instead of letting it join that pile.
One caution during a rollover: verify wherever the money is heading. A joint FINRA and SEC investor alert warns that self-directed IRA custodians only handle paperwork — they do not vet, evaluate, or endorse the investments inside the account, and fraudsters exploit investors who assume otherwise. Stick with a well-known custodian or plan administrator, and treat any “guaranteed profit” pitch tied to a rollover as a red flag, not an opportunity.
Mandatory Roth Catch-Up Rules for High Earners
Starting January 1, 2026, a new SECURE 2.0 rule requires that anyone who earned more than $150,000 in FICA wages the prior year must make any age-50-plus catch-up contributions as Roth, not pretax, under IRS Notice 2025-67. This applies to 401(k), 403(b), and governmental 457(b) plans, though not SIMPLE IRAs or SEPs.
If this applies to you, your catch-up contributions will show up as after-tax Roth money going forward, whether you actively choose that or not — so check your plan’s default before year-end to avoid a surprise.
The New RMD Age and Why It Matters Sooner Than You Think
Required Minimum Distributions now start at 73 for those born 1951–1959, and 75 for those born in 1960 or later, under SECURE 2.0’s phased schedule. Missing an RMD triggers a steep 25% excise tax on the shortfall, reduced to 10% if you correct it within two years, according to the IRS.
Even if 75 sounds distant, the planning starts decades earlier: every Traditional dollar you save now becomes a future required withdrawal, one more reason a healthy Traditional-Roth mix matters more than people assume.
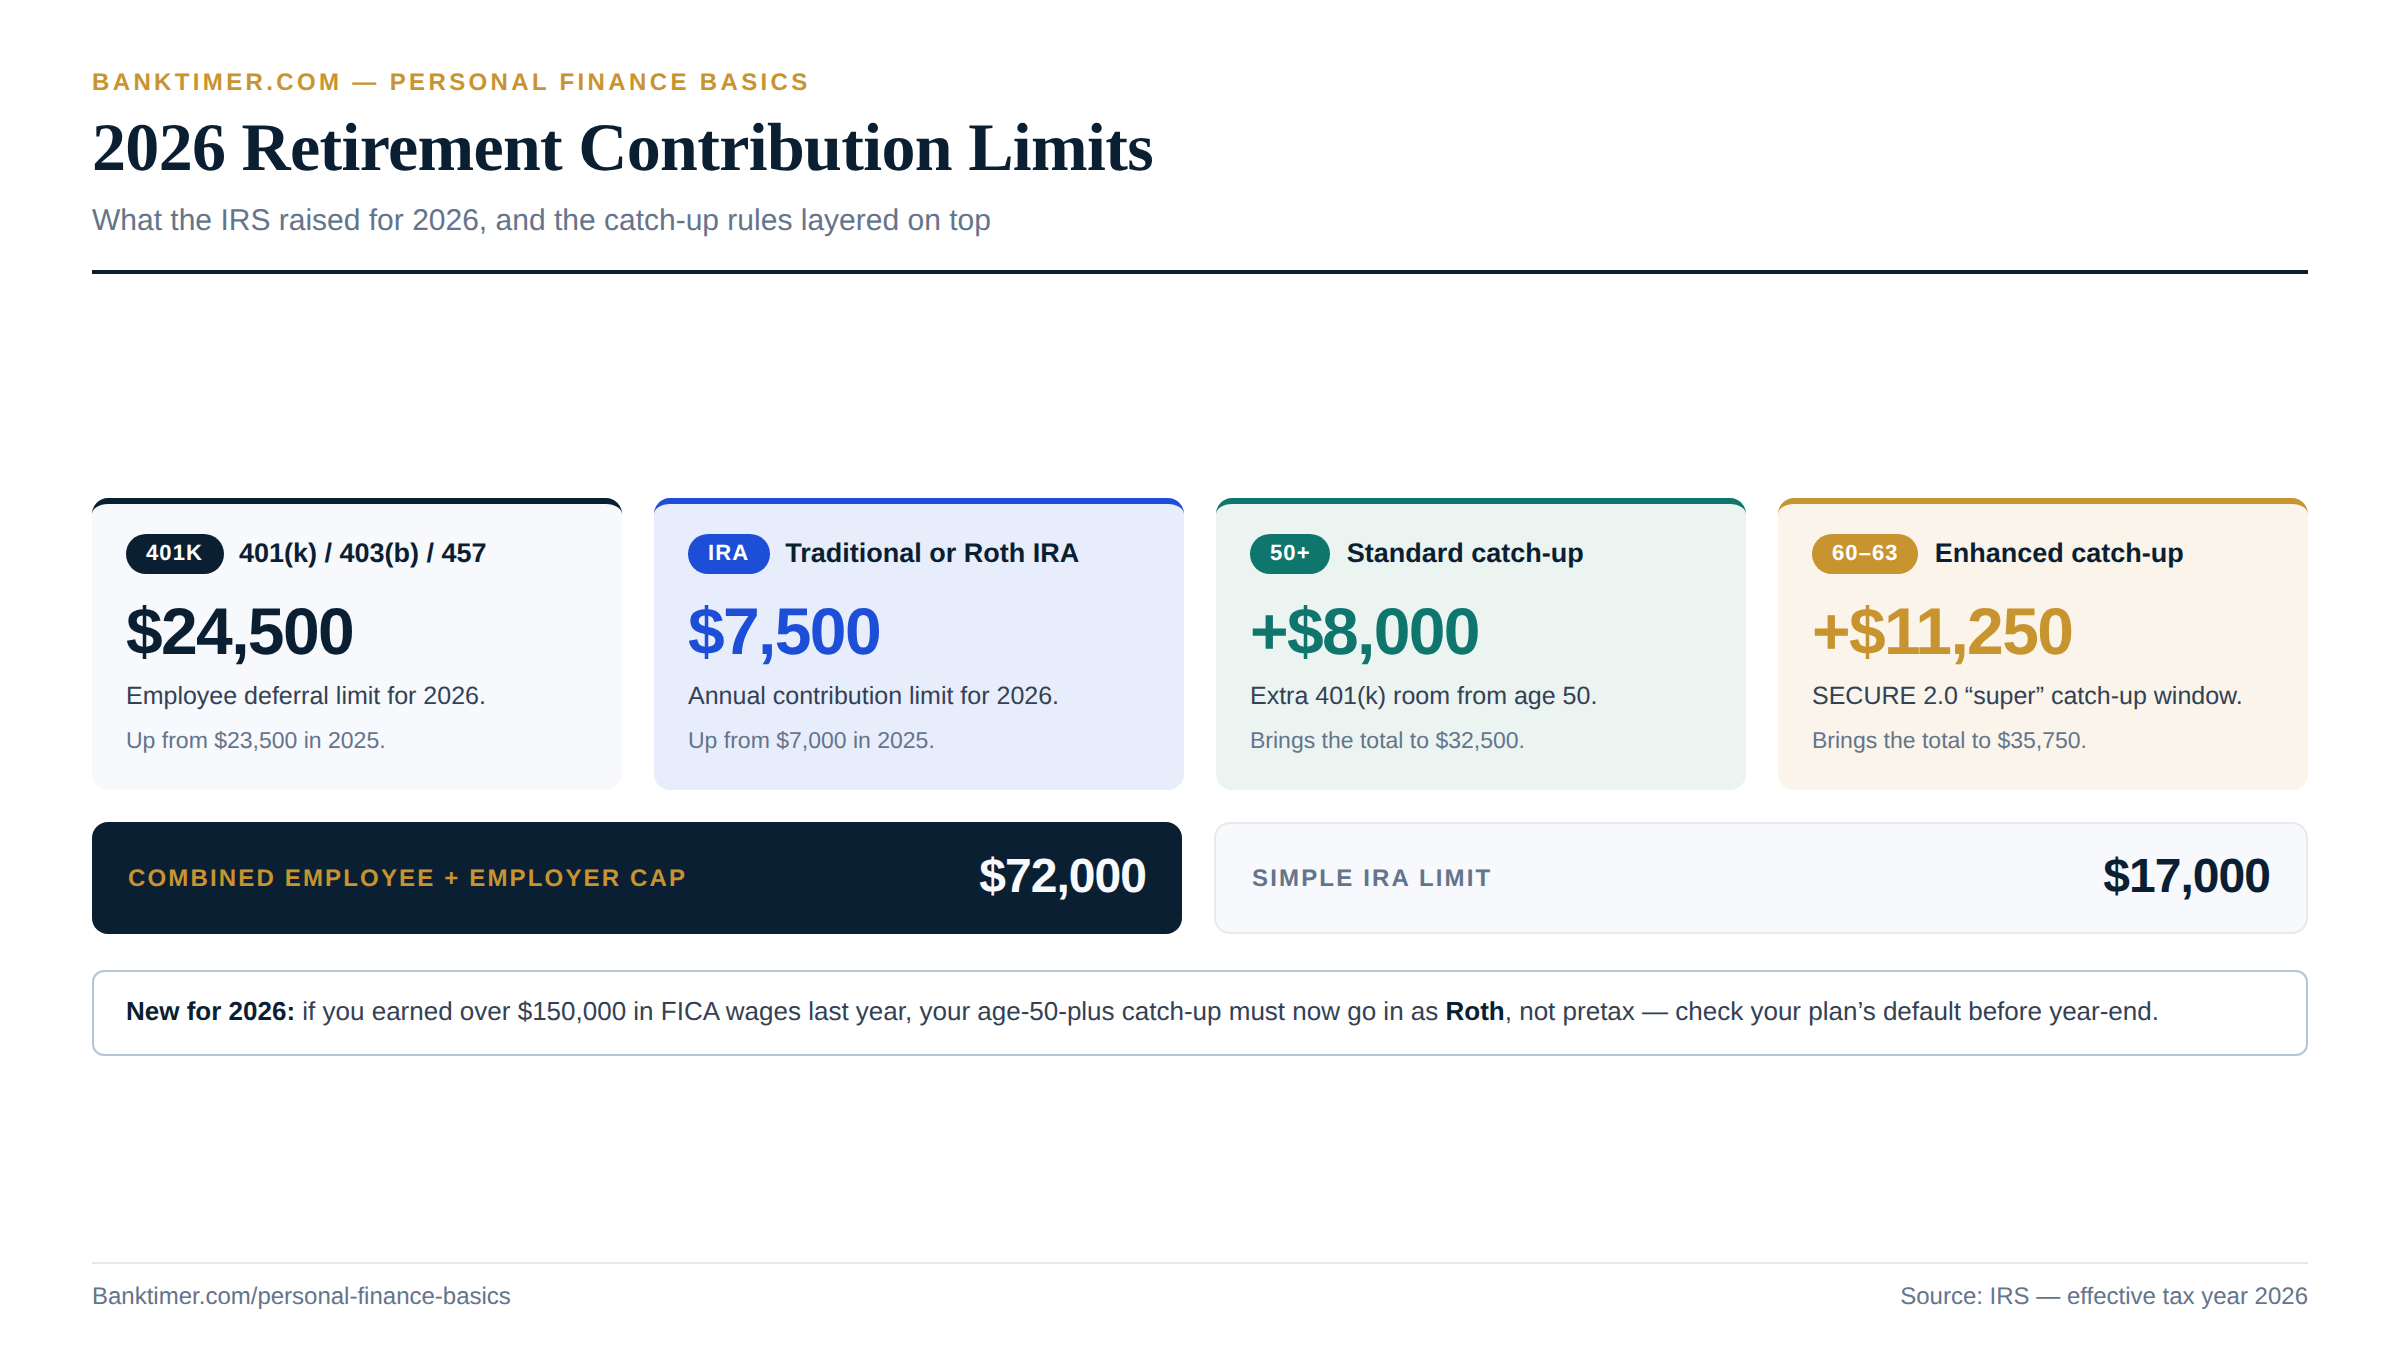
Saving Money
Budgeting decides how much money is left over each month; saving decides what happens to it next. This is where personal finance basics start compounding into real security, whether you’re building a house down payment or just breathing room. The account you choose matters more than ever, because the gap between a basic bank account and a competitive one has never been wider. Below, we cover how these accounts actually work, what the best ones pay right now, and a fintech collapse worth learning from before you move a dollar.
How Modern Savings Accounts Actually Work
Traditional Savings vs. High-Yield Savings Accounts
Big-bank savings accounts — think Chase, Wells Fargo, Bank of America — pay next to nothing, often as low as 0.01% to 0.04% APY, because branch networks are expensive to run. Online-only high-yield savings accounts (HYSAs) from banks like Ally, Marcus, and SoFi skip that overhead and pass the savings on as yield, typically paying several times the national average.
FDIC insurance is identical either way, as long as the bank itself is FDIC-member — you’re not trading safety for a better rate, just skipping unnecessary overhead. That distinction alone is one of the highest-leverage personal finance basics in this whole guide: moving idle cash from a traditional account to an HYSA costs nothing and takes about ten minutes.
Money Market Accounts vs. Money Market Mutual Funds
These two sound identical and get confused constantly, but they’re structurally different products. A money market account (MMA) is a bank deposit account, FDIC-insured just like a savings account, that often pays HYSA-competitive rates while adding limited check-writing or debit-card access. A money market mutual fund is an SEC-regulated investment product — not a bank account, and not FDIC-insured.
Confusing the two is a genuine risk: someone parking emergency cash in a money market mutual fund because it sounds like a savings account is unknowingly taking on investment risk. If deposit insurance matters to you — and for cash you can’t afford to lose, it should — stick with the bank-account version and confirm that directly with the institution.
Certificates of Deposit and CD Laddering
A certificate of deposit (CD) locks a fixed sum for a fixed term — six months, one year, five years — at a fixed rate, with a penalty for early withdrawal. That trade-off makes CDs a poor fit for emergency savings but a strong one for money earmarked for a known date, like a wedding or a down payment 18 months out.
CD laddering solves the “what if rates change” problem: instead of locking everything into one term, you split savings across several CDs — say, 3-, 6-, 12-, and 18-month terms — so something matures regularly and you’re never fully locked out of better rates if they rise.
Sinking Funds vs. Emergency Funds
A sinking fund is money set aside for a known, planned expense — an annual insurance premium, holiday gifts, a car repair you can already see coming. An emergency fund is money set aside for the unplanned kind: a job loss, a surprise medical bill. The two get conflated constantly, and that’s a problem.
Spending down your emergency fund on a sinking-fund expense leaves you with zero cushion the moment a real shock hits. Many HYSAs now offer built-in “buckets” or sub-accounts that let you automate both separately, without opening new accounts elsewhere — a small feature that makes this distinction far easier to actually maintain.
What Savings Rates Look Like in September 2026
Top High-Yield Savings APYs Right Now
As of September 2026, the top HYSAs are paying meaningfully more than they were a year ago. Axos ONE Savings leads at 4.21% (promotional), followed by Vio Bank at 4.09% and CIT Bank Platinum Savings around 4.10% for balances over $5,000, per NerdWallet’s rankings. Marcus by Goldman Sachs pays 3.40% with no minimum deposit and no fees, confirmed directly on marcus.com.
SoFi advertises up to 4.00% total APY through a limited-time “boost” promotion running through the end of 2026, though it requires ongoing direct deposit or a $5,000-plus balance — read the conditions before banking on the headline number. It’s also worth noting that Discover’s savings pages now redirect straight to Capital One’s 360 Performance Savings product, confirming Capital One’s 2025 acquisition of Discover is fully reflected in the consumer banking landscape.
The National Average Is Still Barely Above Zero
Here’s the gap that makes shopping around worth the effort: the national average traditional savings APY sits at just 0.38%, according to consistent tracking from Bankrate, NerdWallet, and CNBC. On a $10,000 balance, that’s the difference between earning roughly $1 to $4 a year at the national average and $300 to $420 a year in a competitive HYSA paying 3–4%.
That’s not a rounding error; it’s real money left on the table for no reason other than inertia. It’s one of the starkest personal finance basics in this entire guide: the “safe” account and the “smart” account can both be FDIC-insured, yet pay wildly different amounts for the exact same risk.
Where Money Market and CD Rates Stand
Money market accounts show the same pattern as savings accounts: the national average sits at just 0.45% APY, while top accounts like Bank5 Connect and Zynlo Bank pay around 3.90–4.00%, per Bankrate. One-year CDs tell a similar story.
The national average for a 1-year CD is 2.05%, but top offers from BTG Pactual Bank, CFG Bank, and Citibank run 4.25–4.35%, according to Bankrate’s CD rate tracker. In every case, national averages reflect legacy big-bank pricing, while online and smaller banks compete aggressively on rate because they need deposits and don’t carry branch overhead.
Typical Savings Balances by Age
For context on where most people actually stand, the Federal Reserve’s Survey of Consumer Finances — 2022 data, the most recent published wave — put the median U.S. savings balance at $8,000 and the mean at $62,410, skewed upward by wealthier households. By age, medians ranged from $5,400 for under-35 households to $13,400 for the 65–74 bracket.
Those figures are a useful benchmark, not a target. Your right number depends on your goals and expenses, not a national median from a survey that’s already a few years old by the time you read it.
How to Actually Move Your Money Into a Better Account
Verify FDIC or NCUA Insurance Yourself
Before depositing a dollar into any new account, verify its insurance status yourself rather than trusting an app’s marketing copy. Banks are FDIC-insured; credit unions are NCUA-insured, with the same standard coverage of $250,000 per depositor, per institution, per ownership category, according to the FDIC. The FDIC’s BankFind tool lets you confirm a bank’s status in under a minute.
This step matters more than it used to, because — as the Yotta case below shows — a company can advertise FDIC insurance that doesn’t actually cover your money the way you’d assume, especially when a middleman sits between you and the bank. Note also that as of April 1, 2024, the FDIC merged revocable and irrevocable trust account categories into one classification, which matters if your household holds over $1.25 million across trust deposits.
Match the Account to the Goal’s Timeline
Not every dollar belongs in the same account. A quick way to think about it:
- Emergency fund or a goal within a year: liquid HYSA or MMA
- A known expense 1–5 years out: a CD, a CD ladder, or Series I Savings Bonds
- Predictable annual costs: a sinking fund, often a labeled “bucket” inside your HYSA
On Series I Savings Bonds specifically, the composite rate resets every May 1 and November 1, so check the current figure directly at TreasuryDirect.gov before committing rather than relying on a rate you saw months ago. Matching the vehicle to the timeline is one of the quieter personal finance basics that separates people who reach goals from people who just save vaguely.
Automate a Fixed Transfer Every Payday
The same pay-yourself-first logic that works for budgeting works even better for saving. Set up an automatic transfer — even $50 or $100 — timed to land the day after each paycheck, moving money straight into your HYSA before you see it in checking.
Automating the transfer removes the monthly decision entirely, so saving doesn’t depend on whatever’s left over after a busy month. Consider routing that transfer to an account at a different bank than your checking account; the small friction of not seeing the balance every time you log in is often enough to keep the money saved instead of casually spent.
Ladder CDs Instead of Guessing on Rates
If you like the certainty of a CD but don’t want to guess where rates head after the Fed’s September 2026 hike, laddering solves the problem. Split your CD savings across staggered terms — three, six, twelve, and eighteen months, for instance — so one matures every few months.
As each CD comes due, you can reinvest at whatever the current rate is or redirect the cash elsewhere. This avoids the classic mistake of locking a large sum into one long term right before rates move higher, a real risk given how uncertain the Fed’s path looks heading into its October 27–28 meeting.
Savings Mistakes, Scams, and the Yotta Lesson
Leaving Cash in a Near-Zero Account Out of Inertia
The single most common savings mistake isn’t exotic — it’s leaving a large balance sitting in a checking or traditional savings account paying 0.01–0.04% APY purely out of loyalty or inertia. Over years, that gap compounds against you rather than for you, quietly costing thousands in lost interest compared to even a plain HYSA.
There’s no loyalty bonus for staying with a big bank that pays nothing. Moving that balance takes one afternoon and typically involves nothing more than opening an online account and setting up a transfer — the hardest part is simply deciding to do it.
The Yotta and Synapse Collapse, Explained
Yotta was a gamified “prize-linked savings” app that routed customer deposits through Synapse Financial Technologies, a banking-as-a-service middleman, into partner banks. In October 2023, Yotta moved accounts into a Synapse subsidiary that wasn’t directly FDIC-insured, without clearly disclosing the change.
When Synapse filed Chapter 11 bankruptcy in April 2024, roughly 85,000 customers found their accounts frozen — about $112 million in funds — because Synapse alone held the ledger reconciling who owned what inside pooled bank accounts, per Moneywise. Some outcomes were brutal: one customer recovered just $0.75 on a $15,000 deposit. California’s DFPI fined Yotta $1 million in May 2026 for deceptively marketing the product as FDIC-insured.
Why a Fintech App’s FDIC Claim Isn’t Enough
More than two years after Synapse collapsed, the Yotta case is still unresolved — a sobering fact on its own. The CFPB allocated $46.25 million from its Civil Penalty Fund in November 2025 and added another $8.97 million as of August 31, 2026, but the timing and amounts of actual payments to depositors remain undetermined as of this writing.
The lesson isn’t “avoid fintech apps.” It’s that an app’s FDIC claim is only as good as the actual account structure behind it. Reduced federal oversight of nonbank fintechs in 2026 makes verifying the underlying bank relationship yourself, rather than trusting a marketing page, a genuine way to protect your money — and one of the personal finance basics too many savers learn only after something goes wrong.
What the September 2026 Rate Hike Changed for Savers
On September 16, 2026, the Federal Reserve raised its target rate range to 3.75%–4.00% — the first hike in roughly three years, passed by a unanimous 12-0 vote. For savers, that’s straightforwardly good news: HYSA, money market, and CD rates have started ticking upward for the first time since the Fed began cutting in 2023.
It’s a real reversal of the slow rate erosion that had pushed savings yields down for years. If you shopped for a savings account a year ago and settled for whatever was available then, it’s worth checking current rates again — what looked competitive in 2025 may already be lagging the pack.
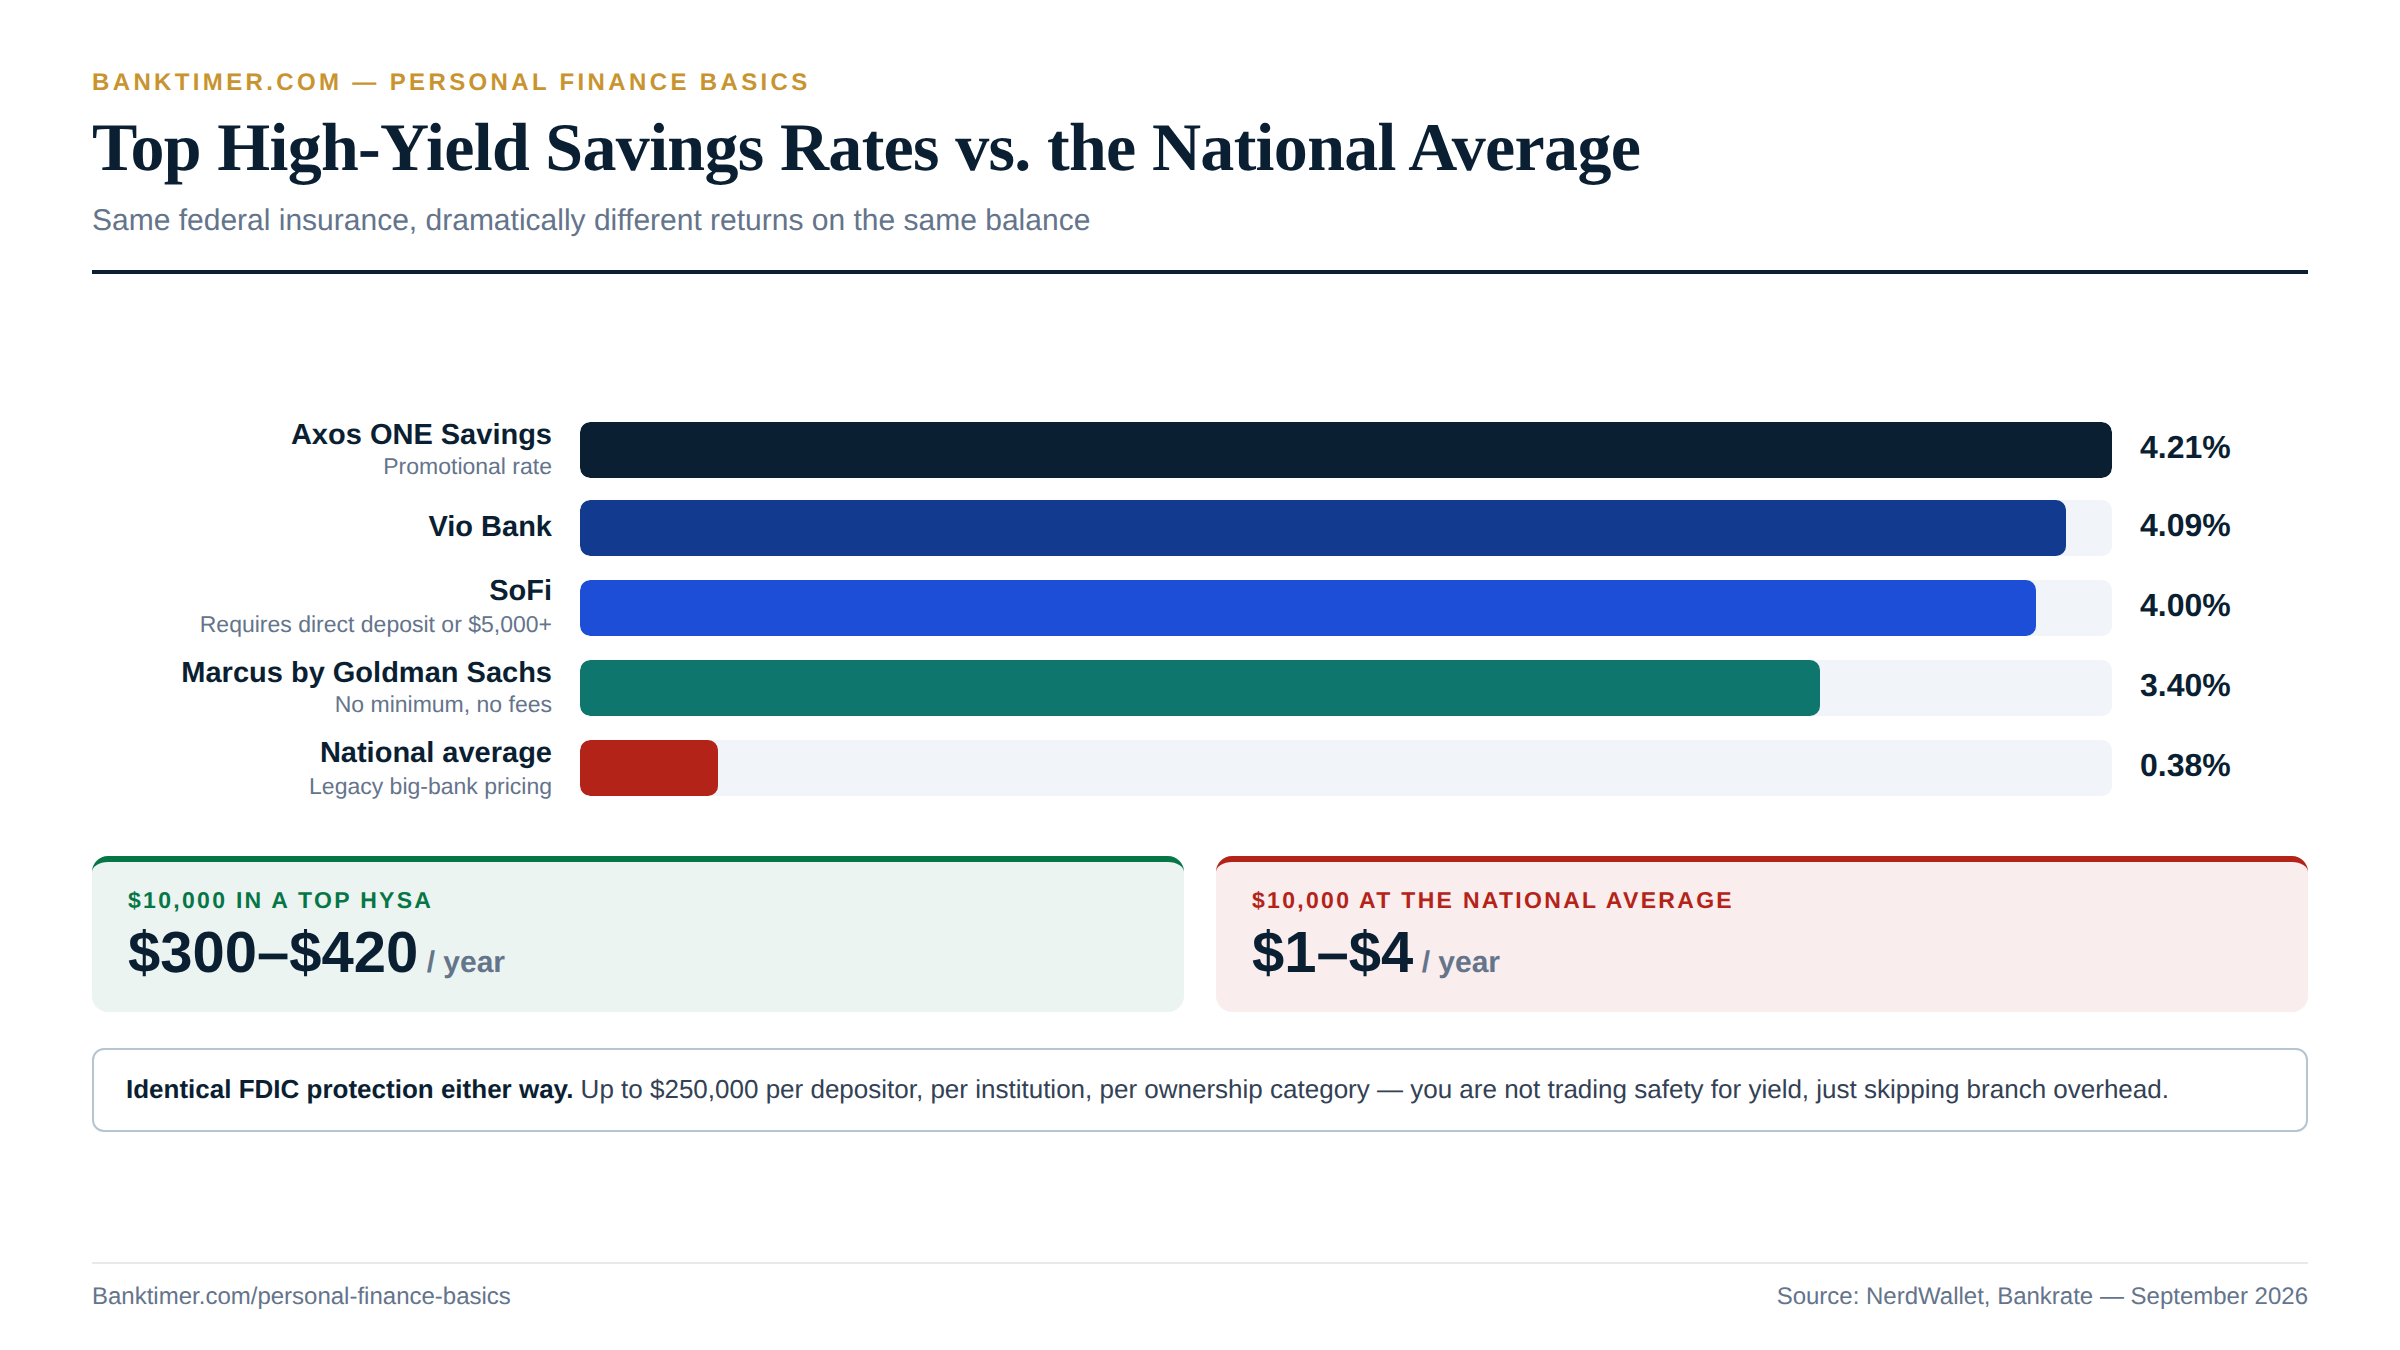
Taxes
Taxes touch every other decision in this guide, from how much your paycheck actually deposits to which retirement account makes sense for your bracket. Understanding the mechanics — not just complaining about the bill — is one of the personal finance basics that pays for itself every April. 2026 brought genuine changes to the tax code, thanks to the One Big Beautiful Bill Act, so even if you’ve filed for decades, some of this year’s numbers and rules are new.
How the U.S. Tax System Actually Works
Marginal Tax Brackets, Explained Without the Confusion
The single most common tax misconception is thinking that earning more money can shrink your take-home pay by pushing your entire income into a higher bracket. That’s not how it works. The U.S. uses a progressive, marginal system, where only the income that falls inside each bracket gets taxed at that bracket’s rate — everything below it is taxed at the lower rates first.
For 2026, single filers pay 10% up to $12,400, 12% above that, 22% above $50,400, and so on up through 37% above $640,600, per the IRS’s 2026 inflation adjustments. A raise never leaves you with less take-home pay.
Standard Deduction vs. Itemizing
Most filers take the standard deduction, a flat amount subtracted from income before any bracket applies. For 2026, that’s $16,100 for single filers, $32,200 for married couples filing jointly, and $24,150 for heads of household. Filers 65 or older, or blind, get an additional $2,050 on top of that (or $4,100 if both apply); married filers get $1,650 extra per qualifying spouse, according to Kiplinger’s rundown of the age-65 provisions.
Itemizing only makes sense if your actual deductible expenses — mortgage interest, charitable giving, state and local taxes — exceed your standard deduction amount. Because the standard deduction has grown so large in recent years, itemizing has become the exception rather than the rule for most households.
Tax Credits vs. Tax Deductions
These two terms get used interchangeably, but they work very differently. A deduction reduces your taxable income, so it’s worth your marginal tax rate times the deduction amount — a $1,000 deduction saves a 22%-bracket filer about $220. A credit reduces your tax bill dollar-for-dollar, which makes it far more valuable: a $1,000 credit saves you the full $1,000.
The Child Tax Credit, worth $2,200 per qualifying child for 2026, is a credit, not a deduction — exactly why it matters so much to families claiming it. It phases out starting at $200,000 of modified adjusted gross income for single filers ($400,000 joint), reduced $50 for every $1,000 over that threshold, and up to $1,700 of it remains refundable even if you owe little or no tax.
Payroll Taxes vs. Income Taxes
Income tax is only part of your federal tax burden. Payroll taxes — Social Security and Medicare — get withheld separately, and they apply to a different base entirely. The Social Security portion applies only up to a wage cap, which rises to $184,500 for 2026.
Unlike income tax, payroll tax is largely flat and doesn’t offer the same deductions and credits. For many middle-income workers, payroll tax actually takes a bigger bite out of each paycheck than federal income tax does — an underappreciated piece of personal finance basics that rarely gets discussed alongside brackets and deductions.
What Changed for Taxes in 2026
2026 Tax Brackets and Standard Deduction
The IRS’s annual inflation adjustments for tax year 2026 explicitly incorporate changes from the One Big Beautiful Bill Act (OBBBA), not just standard inflation indexing. Married couples filing jointly see brackets starting at 10% up to $24,800, climbing to 37% above $768,700.
The standard deduction, listed above, also reflects OBBBA’s provisions. Beyond individual brackets, the law made the $15,000,000-per-person estate tax exemption permanent — a dramatic increase most households will never personally encounter, but a significant shift for high-net-worth estate planning nonetheless. The annual gift tax exclusion, meanwhile, holds steady at $19,000 per recipient for 2026, unchanged from 2025.
Investment income has its own 2026 brackets, which matter directly to the compounding strategies covered earlier in this guide. Long-term capital gains are taxed at 0% up to $49,450 of income for single filers, 15% up to $545,500, and 20% above that, with an additional 3.8% Net Investment Income Tax kicking in above $200,000 MAGI for single filers ($250,000 for joint filers). The Alternative Minimum Tax exemption, which mostly affects higher earners with large deduction claims, sits at $90,100 for single filers and $140,200 for joint filers.
The OBBBA’s New Deductions Explained
OBBBA introduced several genuinely new deductions for the 2025 tax year, continuing into 2026. “No Tax on Tips” lets eligible workers deduct up to $25,000 of reported tip income, phasing out above $150,000 MAGI ($300,000 for joint filers). “No Tax on Overtime” allows a deduction of up to $12,500 ($25,000 joint) on overtime pay, under the same phase-out.
There’s also a new deduction for interest on qualifying U.S.-assembled vehicle loans, and an “Enhanced Senior Deduction” of $6,000 per person 65 or older, per the IRS’s own published schedule. All four are available whether you itemize or take the standard deduction.
The Raised SALT Cap and Who Benefits
The State and Local Tax (SALT) deduction cap jumped to $40,400 for 2026, up dramatically from the flat $10,000 cap that had applied since 2018. That change mainly helps homeowners in high-tax states with significant property and state income tax bills — exactly the filers who bumped hardest against the old ceiling.
The higher cap does phase down for high earners, reduced 30 cents for every dollar of income above $505,000 for joint filers, never falling below the original $10,000 floor. For most middle- and upper-middle-income homeowners, though, this is a real, usable increase in deductible expenses.
529-to-Roth Rollovers and Other New Options
A SECURE 2.0 provision lets families roll unused 529 college-savings funds directly into the account beneficiary’s Roth IRA, up to a $35,000 lifetime cap. The 529 account must have been open at least 15 years, and the specific contributions being rolled over need to be at least five years old.
Annual rollover amounts still count against that year’s normal Roth IRA contribution limit, so it’s not an unlimited bonus — but it’s a meaningful way to repurpose leftover education savings instead of paying a penalty to withdraw them for non-education use.
A Step-by-Step Approach to Tax Planning
Adjust Withholding After Any Big Life Change
Marriage, a new job, a home purchase, or even one of the new OBBBA deductions can throw your withholding out of balance. Too much withheld means you’re giving the government an interest-free loan all year; too little means an unpleasant bill — and potentially a penalty — next April.
The IRS’s current underpayment interest rate is 7%, compounded daily, for the fourth quarter of 2026. Whenever your life or income changes meaningfully, update your W-4 with your employer the same week — one of the simplest personal finance basics tasks there is.
Max Out Tax-Advantaged Accounts Before Year-End
Traditional 401(k) and IRA contributions reduce your taxable income dollar-for-dollar in the year you make them. HSAs go a step further, offering a true triple tax advantage: deductible going in, tax-free growth, and tax-free withdrawals for qualified medical expenses — which is why Fidelity calls the HSA one of the most tax-efficient accounts available anywhere.
If you’re eligible for the Saver’s Credit based on income, claiming it stacks a dollar-for-dollar credit on top of whatever deduction or deferral benefit the contribution itself already provides. For 2026, the full 50% credit tier caps out at $24,250 in AGI for single filers and $48,500 for joint filers, phasing down through 20% and 10% tiers before disappearing entirely above $40,250 (single) or $80,500 (joint), per Fidelity’s Saver’s Credit guide. Check these before December 31 — most retirement deductions can’t be added retroactively once the year closes.
Track Deductible Expenses Throughout the Year
Waiting until tax season to reconstruct a year of deductible expenses is a recipe for missed write-offs. Self-employed and gig workers especially benefit from tracking mileage, home-office costs, and business expenses as they happen, and from making estimated quarterly payments to avoid the underpayment penalty.
Tax-loss harvesting — selling losing investments to offset capital gains, and up to $3,000 of ordinary income — is another strategy that only works if you’re paying attention throughout the year, not scrambling in April. A simple spreadsheet updated monthly beats a shoebox of receipts every time.
Know Your Filing Deadlines and Extensions
The 2026 tax filing season opened Monday, January 26, 2026, and the deadline for 2025 tax returns is Wednesday, April 15, 2026, per the IRS. Filing an extension pushes your paperwork deadline to mid-October, following the standard six-month extension window.
An extension to file is not an extension to pay, though — any tax owed is still due in April to avoid interest and penalties. Mark both dates on your calendar the moment filing season opens, not the week before they hit. And if you’re the one waiting on a refund instead of owing money, the same 7% rate applies in reverse: the IRS pays interest on refunds that take longer than 45 days to process after the filing deadline.
Tax Mistakes, Scams, and 2026 Developments
Missing New Deductions You Actually Qualify For
Because OBBBA’s tips, overtime, car-loan-interest, and senior deductions are brand new for the 2025 filing year, plenty of eligible taxpayers will simply miss them out of habit, especially if they’ve used the same software or preparer for years without flagging the change.
These four deductions are available regardless of whether you itemize, so there’s no reason to leave them unclaimed. If you earned tips, worked overtime, bought a qualifying vehicle, or turned 65 in the past couple of years, double-check your return specifically for these before you file. The car-loan-interest deduction trips people up the most, since it only applies to loans on new, U.S.-assembled passenger vehicles — a used car or one assembled overseas won’t qualify, no matter how the loan itself is structured.
IRS Impersonation and Refund Scams
The IRS’s 2026 “Dirty Dozen” scam list leans heavily on AI-enabled fraud for the first time, including voice-cloned phone calls that spoof caller ID and threaten immediate arrest for unpaid taxes. Phishing texts and emails (“smishing”) now include fake QR codes leading to convincing IRS look-alike websites designed to steal your credentials.
Remember one simple fact: the real IRS never initiates contact by email, text, or social media to demand personal or financial information, and it never threatens immediate arrest over the phone. The same 2026 list also flags fake charities exploiting recent disasters, IRS Online Account takeover attempts, and bogus self-employment tax credit promotions — all worth a healthy dose of skepticism if they land in your inbox.
Confusing a Refund With a Tax-Efficient Outcome
A big refund feels good, but it usually means you overpaid throughout the year and gave the government an interest-free loan on your own money. The more tax-efficient outcome is withholding as close to your actual liability as possible, so that cash sits in your own high-yield savings account earning interest instead.
This is one of the more counterintuitive personal finance basics: a smaller refund, or even owing a small balance, often means your withholding was working correctly — not that something went wrong.
Filing Errors That Trigger an Audit Flag
Common, avoidable errors include mismatched Social Security numbers, math errors, unreported income that doesn’t match the 1099s and W-2s the IRS already has on file, and using a “ghost” tax preparer who refuses to sign the return or provide their IRS Preparer Tax Identification Number. That last one matters legally — you remain responsible for your return’s accuracy even if the preparer who filed it vanishes afterward.
Watch out too for “OIC mills” that charge high upfront fees promising unrealistic debt settlements, and for abusive schemes built around Form 2439 capital-gains claims — both named specifically on the IRS’s 2026 scam list. Double-checking every number against your actual documents before submitting remains the simplest audit-flag prevention there is.
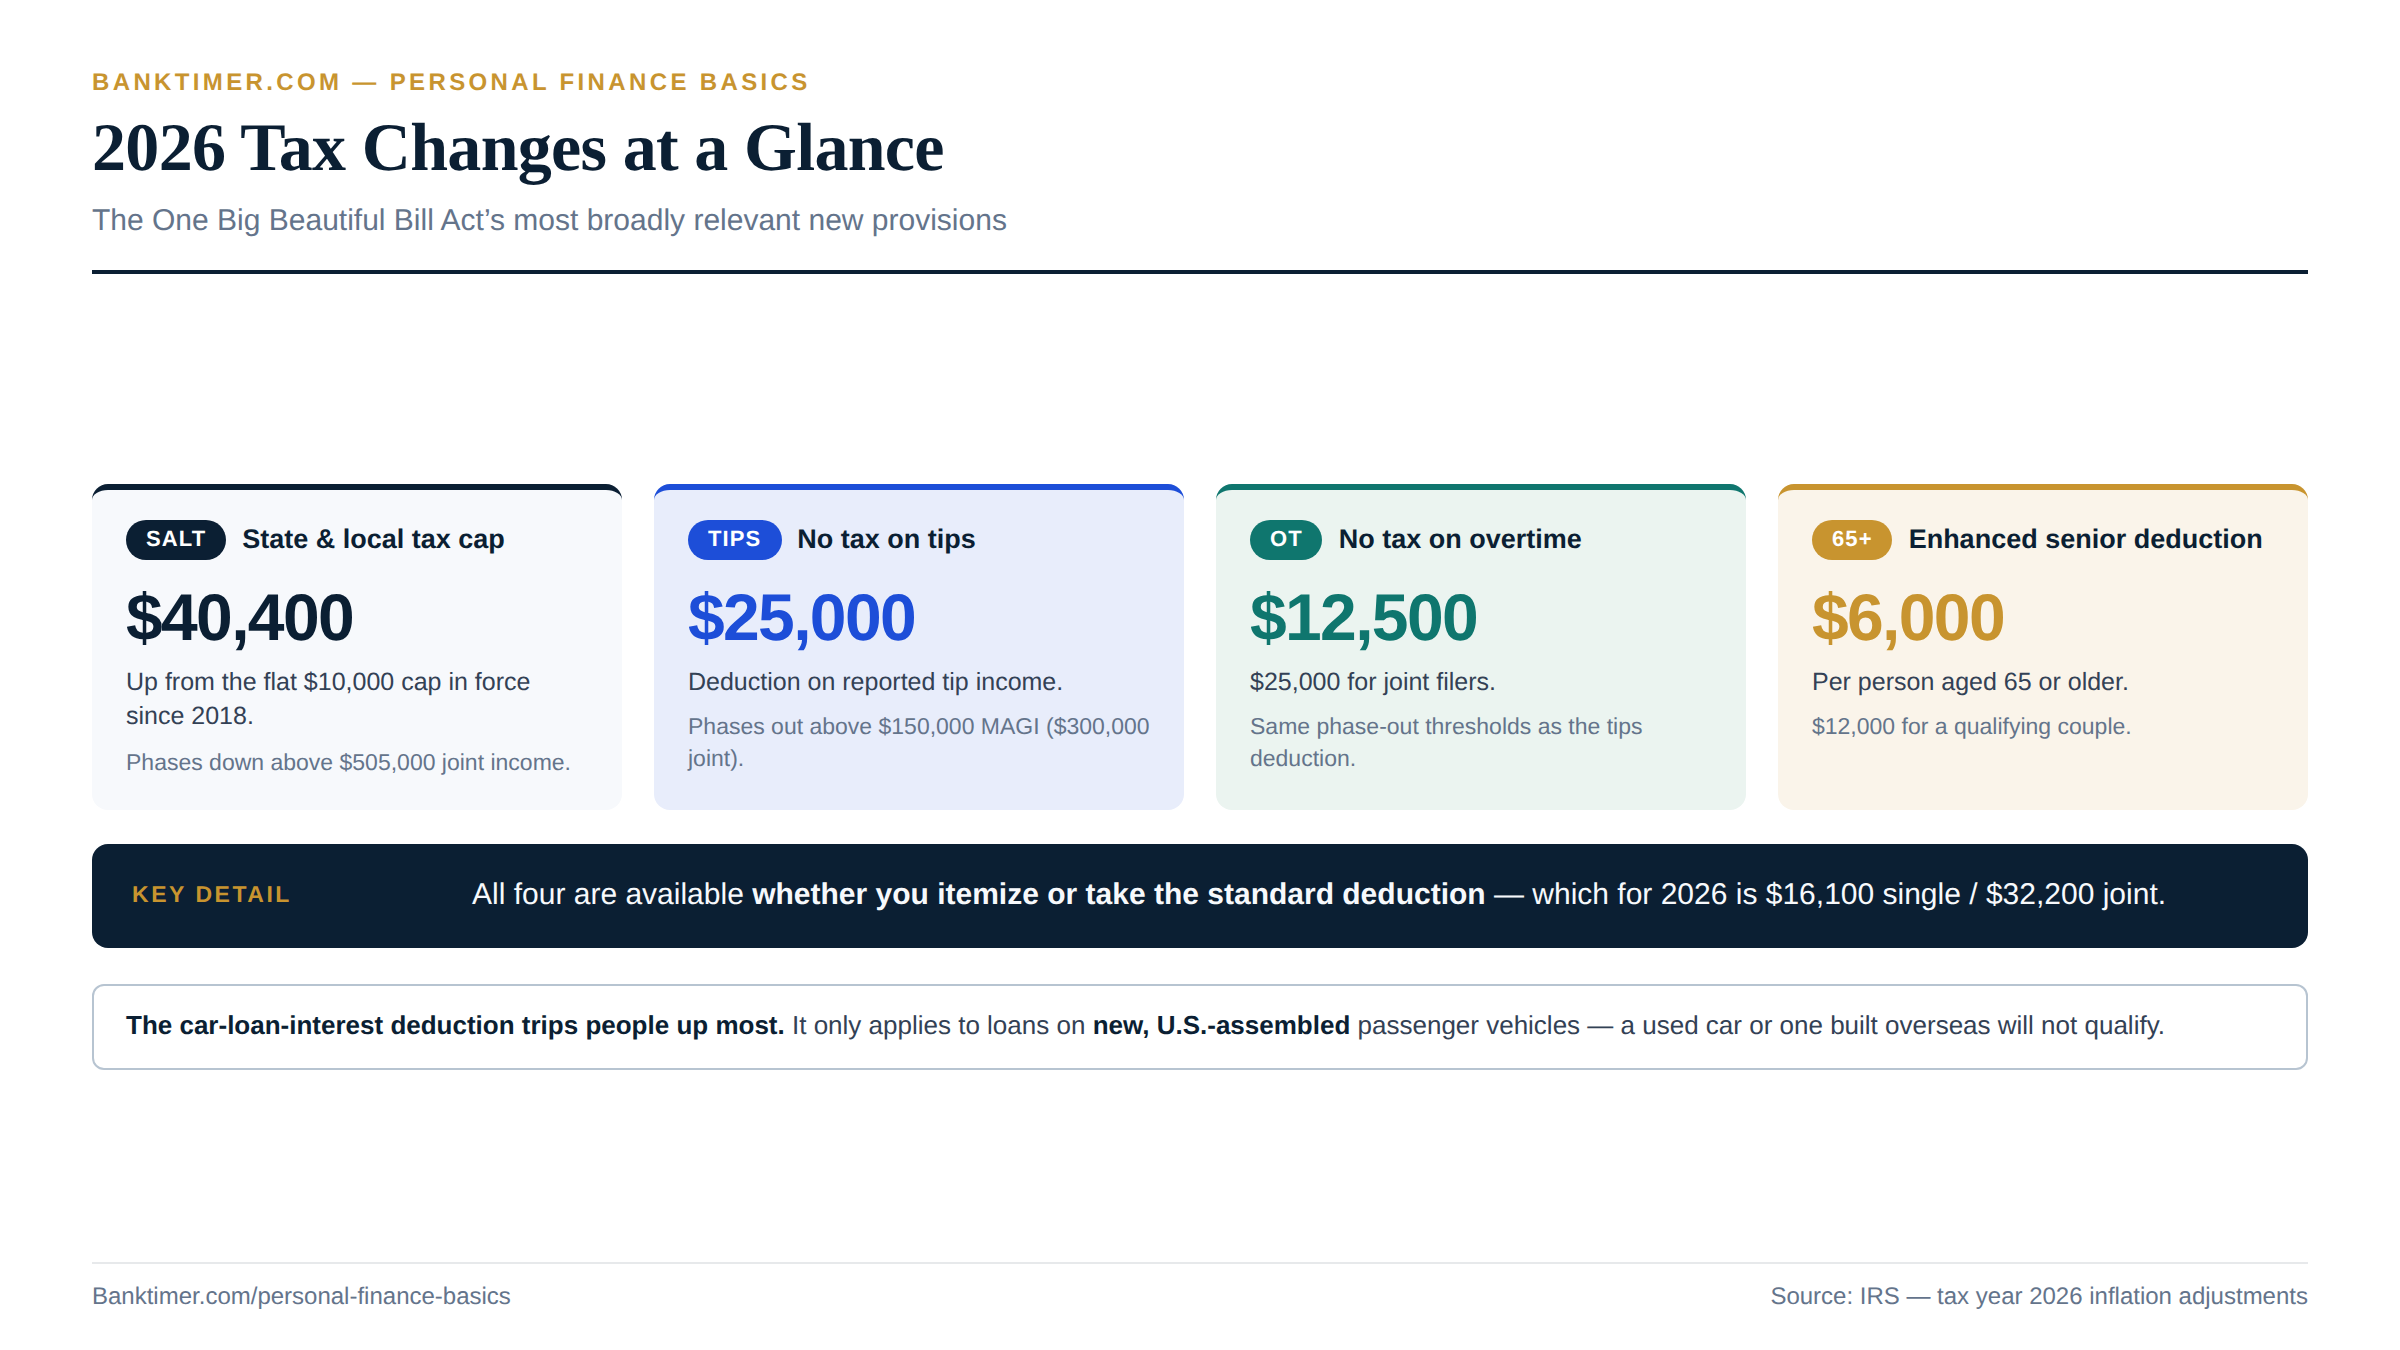
How the Twelve Pillars of Personal Finance Compare
Twelve pillars, one shared goal: matching money you have to needs that arrive on their own schedule. They aren’t competing frameworks — they’re different lenses on the same household budget, and most real financial decisions touch three or four of them at once. The table below puts all twelve side by side so you can see, at a glance, what time horizon each one runs on and the single mistake that costs people the most within it. The full detail behind every figure lives in the section dedicated to that pillar above.
| Pillar | Time horizon | One number to know (Sept 2026) | Biggest mistake to avoid |
|---|---|---|---|
| Budgeting | Monthly, ongoing | Average household spends $78,535/year (2024 data) | Budgeting off gross income instead of take-home pay |
| Compound Interest | Decades | $10,000 at ~4.2% APY grows to ~$15,105 in 10 years | Waiting to start because the amount feels too small |
| Cost of Living | Place to place, point-in-time | Headline CPI up 3.4% year-over-year | Comparing salaries without adjusting for location |
| Debt | Months to years | Total U.S. household debt: $18.77 trillion | Paying only the minimum on a ~22% APR card |
| Emergency Funds | 3–6+ months of expenses | 59% couldn’t cover a $1,000 emergency from savings | Treating a sinking fund like an emergency fund |
| Financial Goals | Short, medium, and long-term | SMART goals need a number and a date | Setting a vague goal with neither |
| Household Costs | Monthly and annual | Housing plus transportation exceed half of spending | Underestimating irregular, annual costs |
| Inflation | Ongoing, month to month | CPI up 3.4% year-over-year (August 2026) | Confusing falling inflation with falling prices |
| Net Worth | Point-in-time snapshot | Median net worth: $192,900 (2022 data, most recent wave) | Comparing yourself to silently stale data |
| Retirement Planning | Decades | 2026 401(k) employee limit: $24,500 | Leaving employer match money on the table |
| Saving Money | Weeks to years | Top HYSA APYs run ~4.00%–4.21% vs. a ~0.4% national average | Leaving cash in a near-zero account out of inertia |
| Taxes | Annual (calendar year) | 2026 contribution limits rose; OBBBA added new deductions | Missing a new deduction you actually qualify for |
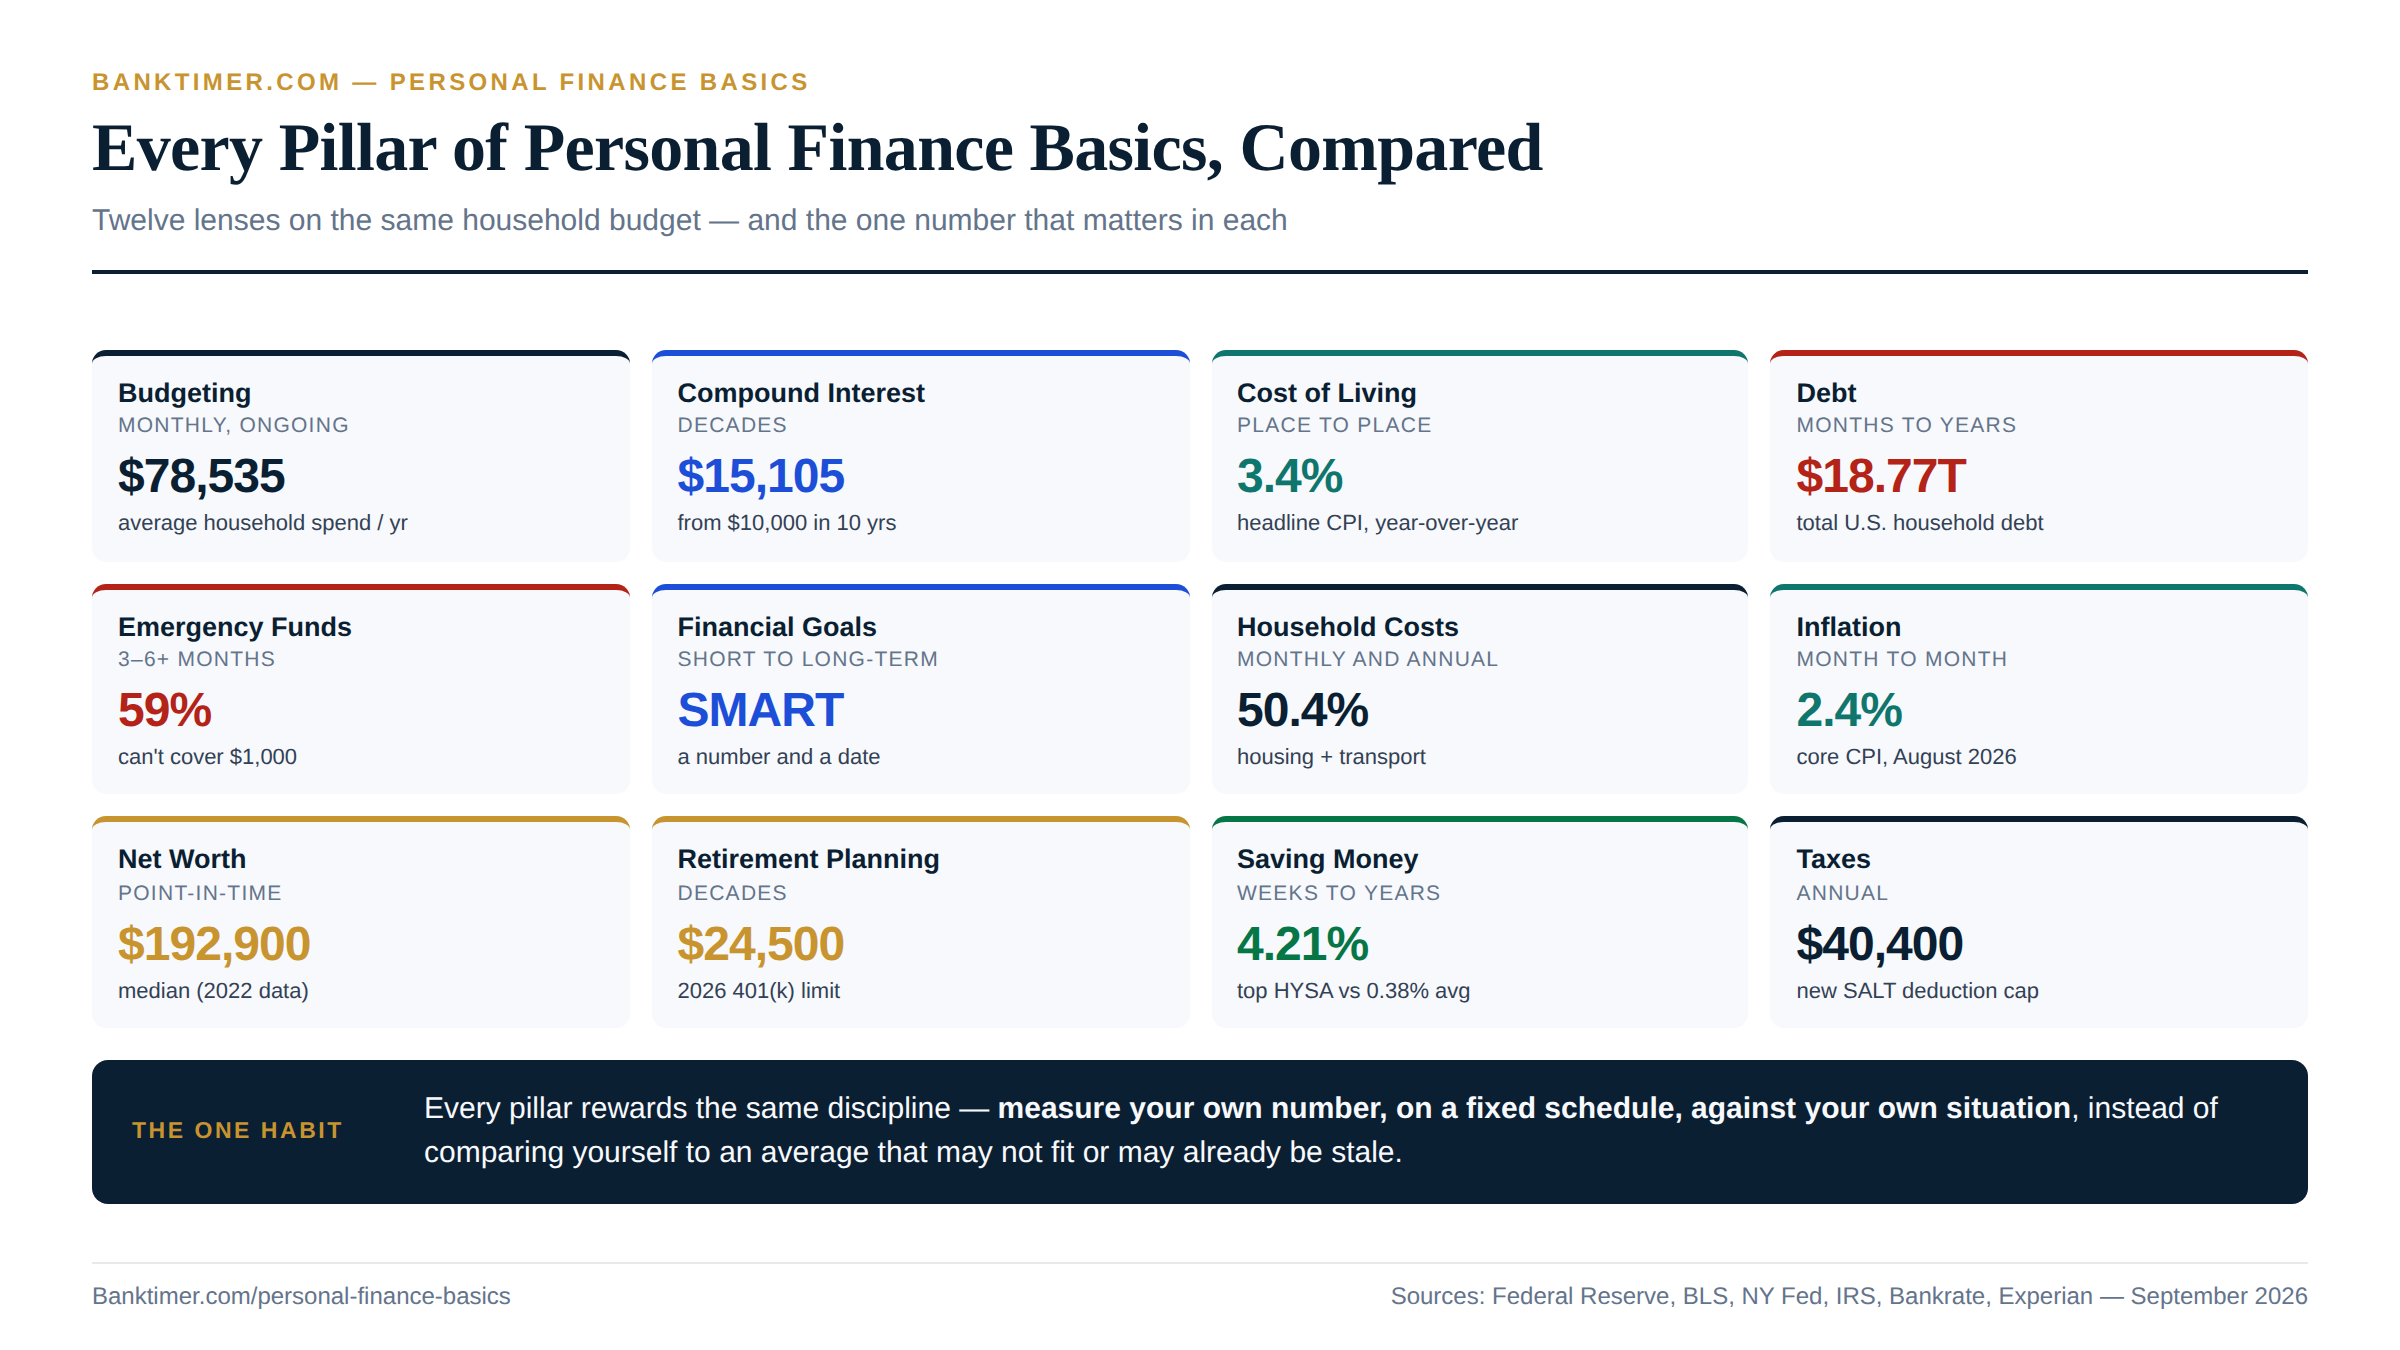
Which Pillars Move Fastest, and Which Barely Change
Some of these numbers update monthly; others update once every three years, whether anyone likes it or not. Inflation, savings rates, and mortgage rates shift constantly — the Federal Reserve alone can move several of them in a single afternoon, as it did on September 16, 2026. Tax brackets and contribution limits update annually, on a schedule the IRS controls. Net worth benchmarks update on the slowest cycle of all: the Federal Reserve’s Survey of Consumer Finances runs only every three years, which is exactly why this guide keeps flagging its 2022 vintage instead of pretending the number is fresher than it is.
Compound interest sits at the opposite extreme from all of it. The math behind “interest on interest” hasn’t changed since it was first formalized, and it never will — only the rate you earn changes. Knowing which category a number falls into tells you how often it’s worth rechecking: an inflation figure is worth a monthly glance, a 401(k) limit is worth an annual one, and a net worth benchmark is worth checking only when a new survey wave actually lands.
How These Twelve Pillars Compound on Each Other
Almost nothing in this guide works in isolation. A realistic budget depends on knowing your actual household costs. An emergency fund target depends on that same budget. A financial goal’s timeline depends on current interest rates, which is why saving money and debt both show up in the goal-setting math. Net worth is really just a scorecard for how well the other eleven pillars are working together over time.
This is also why the mistakes compound. Underfunding an emergency fund makes debt more likely after the next surprise expense. Carrying high-interest debt slows every other goal, because compound interest that works against you in debt is the same force that could be working for you in savings. Treat personal finance basics as one connected system rather than twelve separate chores, and progress in one area tends to make the next one easier instead of starting from zero every time.
Where the September 2026 Rate Hike Shows Up Across This Guide
One Federal Reserve decision touched nearly every pillar in this guide within days. The Fed’s quarter-point hike to a 3.75%–4.00% target range on September 16, 2026 raised the cost of new debt — credit cards, auto loans, and adjustable-rate products all felt it almost immediately — while simultaneously nudging savings, money market, and CD rates higher for anyone with cash sitting in an account. Mortgage rates and household cost-of-borrowing figures moved within the same week.
That split is unusual, and worth sitting with: the same policy move helps savers and squeezes borrowers on the very same day. If you’re carrying debt and building savings at the same time — which describes most households — you felt both sides of it at once. Reading the Debt, Saving Money, and Inflation sections together gives a fuller picture than reading any one of them alone.
Which Pillar to Prioritize Based on Where You’re Starting
There’s no universal order, but a few starting points show up often enough to be worth naming. With no emergency fund and high-interest debt, most guidance — including this one — points toward building a small starter cushion first, then attacking the debt aggressively, then rebuilding the fund to a full 3–6 months. With a stable income and low debt, retirement planning and financial goals deserve the earliest attention, since compound interest rewards an early start more than almost anything else in this guide. With debt but a steady paycheck, run the debt-to-income math from the Debt section before adding new financial goals on top.
The common thread: don’t try to fully solve all twelve pillars simultaneously. Pick the one or two doing the most damage to your finances right now, make real progress there, and let the others wait their turn.
The One Discipline That Applies to All Twelve
Every pillar in this guide rewards the same underlying habit: checking a real number against your actual situation, on a fixed schedule, instead of guessing or comparing yourself to an average that may not fit or may already be stale. A budget only works if you track real spending. A net worth figure only means something if you calculate your own rather than borrowing someone else’s median. An emergency fund only protects you if you know your actual monthly essential costs, not a rough guess.
That discipline — measure your own number, on your own schedule, against your own situation — is worth more than memorizing any specific rate or rule in this guide, because rates and rules will keep changing after publication. The habit of checking is what keeps working regardless.
A 2026 Snapshot: How Personal Finance Got Here This Year
Understanding today’s numbers means understanding how 2026 actually unfolded, because the backdrop behind every pillar in this guide shifted meaningfully over the course of the year.
Inflation ran persistently above the Federal Reserve’s 2% target through most of 2026, landing at 3.4% year-over-year by August. That pressure, combined with a resilient labor market and steady consumer spending, led the Fed to reverse course on September 16, 2026 and raise its benchmark rate a quarter point to 3.75%–4.00% — its first hike in roughly three years, passed by a unanimous 12-0 vote under new Fed Chair Kevin Warsh. The Fed’s own dot plot signaled no cuts through 2027 and left the door open to at least one more 2026 hike, a meaningfully different trajectory than the cutting cycle that had defined 2023 through mid-2026.
Tax law shifted just as much. The One Big Beautiful Bill Act, first effective for tax year 2025, continued reshaping 2026 filings: it permanently extended most 2017 tax cuts, raised the SALT deduction cap to $40,400, and introduced new deductions for tips, overtime pay, car loan interest, and seniors. SECURE 2.0 provisions kept phasing in on schedule, including mandatory Roth catch-up contributions for higher earners and a rising Required Minimum Distribution age.
Consumer protection shrank at the same time consumer risk arguably grew. Congress cut the Consumer Financial Protection Bureau’s funding cap roughly in half in mid-2025, and by 2026 the agency’s capacity to supervise nonbank fintech apps, examine debt-relief companies, and pursue enforcement actions had been sharply reduced. That combination — elevated rates, new tax rules, and thinner federal oversight — is the backdrop every pillar in this guide operates against heading into 2027, and it’s part of why this guide leans so heavily on “verify it yourself” guidance rather than “trust that someone’s already checking.”
How to Prioritize These Personal Finance Basics for Your Situation
If You’re Just Starting Out
Build a simple budget first, even a rough one, so you know your real numbers. Open a high-yield savings account and start a starter emergency fund of $500–$1,000 before anything else. If your employer offers a 401(k) match, capture it from your very first paycheck — compound interest rewards an early start more than a large one.
If You’re Carrying High-Interest Debt
Run your debt-to-income ratio and list every balance with its actual APR. Choose the avalanche method if you’re motivated by saving the most money, or the snowball method if you need quick wins to stay consistent. Keep a small emergency cushion even while paying down debt, so the next surprise expense doesn’t become new debt.
If You Have No Emergency Fund Yet
Start with a number you can actually hit in a few months — $500 or $1,000 — before worrying about the full 3–6 month target. Automate a fixed transfer on payday into a dedicated, FDIC-insured account kept separate from your checking account.
If You’re Behind on Retirement Savings
Capture your full employer match first; it’s the highest guaranteed return available to most people. Use the 2026 catch-up contribution limits if you’re 50 or older, and consider the enhanced catch-up available at ages 60–63. Small increases with every raise close a gap faster than waiting for one large contribution.
If You’re Comparing Job Offers or Considering a Move
Run the cost-of-living math before comparing raw salary numbers — a higher offer in a higher-cost area can be a real pay cut. Factor state and local taxes into the comparison, not just headline salary, since take-home pay is what actually funds every other pillar in this guide.
If You’re Self-Employed or a Freelancer
Size your emergency fund toward the higher end of the range, six to nine months or more, since you don’t have an employer’s unemployment cushion behind you. Set aside a fixed percentage of every payment for quarterly estimated taxes so a tax bill never becomes an emergency of its own.
If You’re Nearing a Major Life Change
Recalculate your net worth and update your financial goals before a marriage, a new dependent, a home purchase, or a career change — the targets that made sense before rarely survive the change unadjusted. Revisit your budget and emergency fund size at the same time, since household costs almost always shift with a major life change.
The Four Mistakes That Cost People the Most, Across Every Pillar
Treating Old Data as Current
Two of the most commonly repeated “current” statistics in personal finance — net worth by age and average household spending — are both running on data that’s a year or more old. Believing a stale number is fresh leads to comparisons that don’t mean what they seem to.
Comparing Yourself to an Average That Doesn’t Fit
A national median assumes a household that may not resemble yours in location, age, income, or family size. Cost of living, household costs, and net worth all vary enormously by region and life stage — benchmark against your own numbers and circumstances first, and treat national averages as context, not a verdict.
Letting Complexity Delay Starting
Waiting for the “right” budgeting method, the perfect emergency fund size, or a full understanding of tax law before taking any action costs more than starting imperfectly. Compound interest and consistent habits reward the person who started imprecisely five years ago more than the person who’s still planning the perfect approach today.
Ignoring How the Twelve Pillars Interact
Optimizing one pillar while ignoring its effect on the others is a common trap — aggressively paying down debt while leaving zero emergency cushion, for instance, or maximizing retirement contributions while carrying a 22% APR balance that costs more than any retirement account is likely to earn. Read your finances as one connected system, not twelve separate boxes to check.
Questions to Ask Yourself Before Any Big Financial Decision
Before you decide, check every item
- ☐ Have I checked my current budget and cash flow, not just my account balance, before committing to this?
- ☐ Does this decision touch my emergency fund, and if so, how will I rebuild it afterward?
- ☐ What’s the real APR or APY involved, not just the advertised rate?
- ☐ Am I comparing this against a current, dated number — or an average that might already be stale?
- ☐ How does this decision change my net worth trend over the next year, not just today?
- ☐ Have I accounted for how this affects my taxes for the current filing year?
- ☐ Is there a cheaper or better-structured way to reach the same underlying goal?
- ☐ If this involves an app or company I haven’t used before, have I verified it independently rather than trusting its own marketing?
Who This Guide Suits
This guide is built for anyone building their financial foundation from the ground up — someone starting their first budget, a couple building an emergency fund together, a family weighing a move and needing real cost-of-living numbers, or someone finally ready to tackle debt, calculate their net worth honestly, or catch up on retirement savings. It’s equally useful as a reference to return to later: bookmark it, and come back to the specific pillar you need whenever a new financial decision comes up, rather than starting your research over from scratch each time.
Frequently Asked Questions
What are personal finance basics, exactly?
Personal finance basics are the foundational skills and concepts behind managing money well: budgeting, saving, handling debt, understanding net worth, planning for retirement, and the recurring forces — inflation, taxes, cost of living — that affect all of it. This guide treats all twelve as connected parts of one system rather than separate subjects.
Where should I start if I’m overwhelmed by all twelve pillars at once?
Start with a basic budget and a small emergency fund — $500 to $1,000 — before tackling anything else. Those two give you the visibility and cushion to make every other decision in this guide with less risk.
Is the 50/30/20 budgeting rule still realistic in 2026?
It’s still the most commonly recommended starting framework, though many households in high-cost areas find “needs” now exceed 50% of take-home pay. Treat it as a flexible starting point, not a rigid rule, and adjust the splits to your actual fixed costs.
How much should I really have in an emergency fund?
Three to six months of essential expenses is the standard range, with self-employed or single-income households often better served by six to nine months or more. The right number depends more on job stability than on any fixed dollar amount.
Why do so many net worth statistics online say “2026” when the data is really from 2022?
The Federal Reserve’s Survey of Consumer Finances, the main source for net worth by age, only runs every three years. The 2022 wave is still the most recently published one as of September 2026, so any site presenting current-year net worth benchmarks is almost certainly repackaging that same 2022 data.
What’s the fastest way to pay down multiple debts?
The debt avalanche method (highest interest rate first) saves the most money mathematically. The debt snowball method (smallest balance first) often works better behaviorally, because early wins keep people motivated. Either beats making only minimum payments across the board.
Does the September 2026 Fed rate hike help or hurt me?
Both, usually at the same time. It raises the cost of new debt — credit cards, auto loans, adjustable-rate products — while also raising yields on savings accounts, money market accounts, and CDs. Most households feel both effects simultaneously.
How is compound interest different from simple interest?
Simple interest only pays on your original amount. Compound interest pays on your original amount plus all previously earned interest, which is why the gap between the two grows dramatically over longer time periods.
What’s the single biggest retirement planning mistake?
Leaving employer 401(k) match money unclaimed. It’s an immediate, guaranteed return that beats nearly every other investment available to most savers, yet a meaningful share of eligible employees don’t contribute enough to capture the full match.
How do I actually calculate my net worth?
Add up everything you own at honest, current values — cash, investments, retirement accounts, real estate, vehicles — then subtract everything you owe, including debts that don’t feel like “real” debt, like money owed to family or a next tax bill. What’s left is your net worth.
Is it bad to have a negative net worth?
Not necessarily, especially early in adulthood or shortly after taking on student debt or a mortgage. The trend over time matters far more than any single snapshot — a negative but steadily improving net worth is a healthier sign than a positive one that’s shrinking.
What’s the difference between cost of living and inflation?
Inflation measures how prices change over time in one place. Cost of living compares prices between different places at the same point in time. They use related data but answer different questions.
How do the 2026 tax changes affect an average household?
The most broadly relevant changes are the extended 2017 tax provisions, a higher SALT deduction cap, new deductions for tips and overtime for qualifying workers, and increased 401(k) and IRA contribution limits. Whether any specific provision helps depends heavily on individual income, filing status, and location.
Should I keep my emergency fund in the same account as regular savings?
Most guidance recommends a separate, dedicated account so the money doesn’t blend into everyday spending or get treated as available for non-emergencies. It should still be liquid and FDIC- or NCUA-insured, just kept apart.
How often should I check my net worth or review my budget?
Quarterly is a common, sustainable cadence for net worth — frequent enough to catch trends, infrequent enough to avoid reacting to daily market noise. A budget benefits from a monthly check-in, with a deeper review after any income or major expense change.
Are online “high-yield” savings accounts advertising 10% APY legitimate?
Read the fine print carefully. Some of these are reward-checking-style products with narrow qualifying conditions — balance caps, required debit card usage — rather than a straightforward high-yield savings account. Always verify FDIC or NCUA insurance directly with the institution.
Will reading this whole guide help if I only need one pillar right now?
Yes. Each section stands on its own, so you can jump straight to the pillar you need and get current numbers, steps, and mistakes to avoid without reading the other eleven sections first. The comparison and snapshot sections above are worth a skim regardless of which single pillar brought you here.
How to Verify These Numbers Yourself
Every rate and statistic in this guide is dated to the specific source and period it came from — the Federal Reserve, the Bureau of Labor Statistics, the New York Fed, the IRS, Bankrate, and Experian, among others — because personal finance basics only stay useful if the numbers behind them stay current. Rates like savings APYs, credit card APRs, and mortgage rates shift weekly or monthly; check the live source page directly rather than treating any figure in this guide as a permanent quote. Net worth and household spending benchmarks update far more slowly — verify you’re looking at the same vintage this guide cites (2022 for net worth, 2024 for full-year household spending) before drawing conclusions from a “more current-looking” number elsewhere, since it may simply be the same data relabeled.
Building Your Own Personal Finance Dashboard
Reading this guide section by section is useful, but building your own simple tracker — even a basic spreadsheet — is the best way to apply it to your actual situation. Track four numbers on a fixed schedule: your monthly budget versus actual spending, your emergency fund balance against your target, your total debt against your payoff plan, and your net worth calculated quarterly.
Updating that tracker takes a few minutes each month, and it’s the step most people skip in favor of a mental estimate. A mental estimate is usually wrong in the optimistic direction — real tracking catches problems while they’re still small and confirms progress that might otherwise go unnoticed.
Keep the same tracker going even after you’ve built healthy habits. The discipline of checking real numbers against your actual situation, on a fixed schedule, is the one habit from this entire guide worth carrying forward indefinitely.
Key Terminology
| Term | What it means |
|---|---|
| 50/30/20 rule | A budgeting framework splitting after-tax income into 50% needs, 30% wants, and 20% savings and debt paydown |
| Zero-based budgeting | A method where every dollar of income is assigned a specific job until income minus allocations equals zero |
| APY (Annual Percentage Yield) | The effective yearly return on savings, already factoring in compounding frequency |
| APR (Annual Percentage Rate) | The standardized yearly cost of borrowing, combining the interest rate with mandatory fees |
| Compound interest | Interest calculated on both the original principal and previously accumulated interest |
| Simple interest | Interest calculated only on the original principal, never on previously earned interest |
| Debt-to-income ratio (DTI) | Total monthly debt payments divided by gross monthly income |
| Debt avalanche | A payoff method that targets the highest-interest debt first to minimize total interest paid |
| Debt snowball | A payoff method that targets the smallest balance first to build motivation through quick wins |
| Net worth | Total assets minus total liabilities, measured at a single point in time |
| Survey of Consumer Finances (SCF) | The Federal Reserve’s triennial household survey, the primary source for net worth data by age and income |
| Emergency fund | Liquid savings set aside to cover unplanned essential expenses, typically 3–6 months of costs |
| Sinking fund | Savings set aside for a known, planned future expense, distinct from an emergency fund |
| High-yield savings account (HYSA) | An FDIC- or NCUA-insured savings account, usually online-only, paying well above the national average rate |
| Money market account (MMA) | An FDIC-insured deposit account offering competitive rates with limited check or debit access |
| Certificate of deposit (CD) | A fixed-term deposit paying a fixed rate, with a penalty for early withdrawal |
| CPI (Consumer Price Index) | The government’s primary measure of how prices for a fixed basket of goods change over time |
| Core CPI | Consumer Price Index excluding volatile food and energy prices |
| Cost-of-living index | A comparison of prices for the same basket of goods across different locations at one point in time |
| SMART goals | A goal-setting framework requiring goals to be Specific, Measurable, Achievable, Relevant, and Time-bound |
| 401(k) | An employer-sponsored retirement account allowing pre-tax or Roth contributions, often with an employer match |
| Traditional vs. Roth | Traditional accounts are funded pre-tax and taxed on withdrawal; Roth accounts are funded after-tax and grow tax-free |
| Employer match | Additional retirement contributions an employer makes based on an employee’s own contributions |
| Required Minimum Distribution (RMD) | The mandatory minimum amount that must be withdrawn annually from certain retirement accounts after a set age |
| Catch-up contribution | An additional retirement contribution allowed for savers age 50 and older, beyond the standard limit |
| Marginal tax bracket | The tax rate applied only to income within a specific income range, not to all income earned |
| Standard deduction | A fixed dollar amount that reduces taxable income without itemizing individual expenses |
| SALT cap | The federal limit on how much state and local tax payments can be deducted on a federal return |
| FDIC / NCUA insurance | Federal deposit insurance protecting bank or credit union deposits up to $250,000 per depositor, per institution, per ownership category |
| Federal funds rate | The Federal Reserve’s benchmark interest rate, influencing borrowing and savings rates throughout the economy |
Banktimer Bottom Line
There is no single most important pillar in personal finance — only the one that matters most for your situation right now, and this guide is built to help you find it. Budgeting gives you visibility, an emergency fund gives you a cushion, debt payoff and saving money both lean on the same discipline of paying yourself before you spend, and net worth is simply the long-run scorecard for how well the rest are working together. The habit that separates steady financial progress from constant financial stress isn’t a single trick — it’s checking real, current numbers against your own situation, on a fixed schedule, rather than guessing or comparing yourself to an average that may not fit or may already be stale. Rates move with the Federal Reserve, tax rules move with Congress, and survey data updates on its own slow schedule — as 2026 demonstrated on every one of those fronts at once — and the only durable defense is verifying the current numbers before you act on them, rather than trusting that anything in a guide this size stays accurate forever. If this guide has one job, it’s to make these twelve pillars of personal finance basics feel like one connected system you can actually manage, instead of twelve separate subjects to feel behind on.
Sources
- Federal Reserve — FOMC Press Release, September 16, 2026
- Federal Reserve — Survey of Consumer Finances
- Federal Reserve — Distributional Financial Accounts
- Federal Reserve — Consumer Credit (G.19)
- Federal Reserve Bank of New York — Household Debt and Credit Report
- Bureau of Labor Statistics — Consumer Price Index
- Bureau of Labor Statistics — Consumer Expenditure Survey
- Consumer Financial Protection Bureau — Debt-to-Income Ratio
- Consumer Financial Protection Bureau — Credit Counselor vs. Debt Settlement
- Federal Trade Commission — Credit Repair Scams
- FDIC — Deposit Insurance
- IRS Newsroom — 2026 Retirement Plan Contribution Limits
- Investor.gov — Compound Interest Calculator
- Freddie Mac — Primary Mortgage Market Survey
- Bankrate — Emergency Savings Report
- Bankrate — High-Yield Savings Rates
- Experian — State of Credit Cards
- NerdWallet — Average Net Worth by Age
Methodology
Rate and yield figures throughout this guide reflect national averages and leading offers published by the Federal Reserve, Bankrate, Experian, and NerdWallet, accessed in September 2026; these figures move weekly or monthly and should be reconfirmed against the live source before relying on them for a specific decision. Net worth figures reflect the Federal Reserve’s 2022 Survey of Consumer Finances, the most recently published wave as of this guide’s writing; household spending figures reflect the Bureau of Labor Statistics’ full-year 2024 Consumer Expenditure Survey, released in December 2025 — both are labeled by their actual vintage rather than presented as current-year data. Tax figures reflect IRS guidance for tax year 2026 as published by the IRS Newsroom. Regulatory information regarding the CFPB reflects public reporting current as of September 2026; agency funding, staffing, and enforcement posture are subject to further change. This guide is educational and does not constitute financial, legal, or tax advice — a reader facing a specific decision should consult a qualified professional along with current, binding disclosures from their own financial institution.
Your next step
Before you do anything else with this guide, calculate two numbers today: your current net worth and your current monthly essential expenses. Together, those two figures tell you where you actually stand and how large your emergency fund target should be — and they take less than twenty minutes to work out with a bank statement and a calculator. Every other pillar in this guide becomes easier to apply once you know those two starting numbers for your own situation, rather than relying on a national average that may not describe you at all.