

By the Banktimer Editorial Team · Published
Banktimer is an independent U.S. consumer-finance publication. Our editors draw on primary and official sources first, such as the CFPB, FDIC, Federal Reserve, and FTC, along with statutes, regulations, and providers’ own agreements and fee schedules. Then we add worked examples and decision tools. Our goal is the most useful, best-supported explanation the sources available to us at the time of writing allow.
This article is general information, not legal, tax, investment, insurance, or financial advice, and reading it does not create a professional relationship with Banktimer. Rates, fees, limits, and rules change, and they vary by state, provider, and contract, so confirm current terms with your bank, lender, insurer, or the agency named in the article before you act. Examples are illustrative unless labeled otherwise. Banktimer is not a bank, lender, insurer, or financial advisor, and we are not responsible for decisions or losses that result from relying on this content. For advice about your own situation, talk to a licensed professional.
Walk into almost any town in the United States or Canada and you’re within a few miles of a branch that belongs to one of the largest banks in North America. That’s not an accident. A small group of institutions — a handful of trillion-dollar money-center giants, a tier of well-run super-regionals, a cluster of specialist card, investment, and custody banks, and Canada’s dominant Big Three — controls the overwhelming majority of deposits, loans, and investment assets on the continent. If you bank, invest, or borrow anywhere in North America, odds are good your money touches one of the 18 institutions in this guide.
This report profiles each of those 18 banks in detail: JPMorgan Chase, Bank of America, Citigroup, Wells Fargo, U.S. Bancorp, PNC Financial Services Group, Truist Financial, Fifth Third Bancorp, Citizens Financial Group, Capital One, Goldman Sachs, Morgan Stanley, Charles Schwab, State Street, The Bank of New York Mellon (BNY), Royal Bank of Canada, TD Bank Group, and Bank of Montreal (BMO). For each one, you’ll find the same set of questions answered in the same order — corporate history, financial scale, product lineup, and reputation — so you can compare institutions apples to apples rather than digging through inconsistent marketing pages.
We built this guide because most “biggest bank” rankings stop at a single number, usually total assets, and call it a day. That single number hides more than it reveals. A custodian bank like State Street or BNY can carry over $50 trillion in client assets under custody while showing a balance sheet a fraction the size of Wells Fargo’s. A card-focused bank like Capital One can serve tens of millions of cardholders it will never meet in a branch. Two Canadian banks headquartered blocks apart in Toronto can have almost nothing in common once you look at their U.S. footprints. This guide is written for readers who want the real picture — how big, how profitable, how risky, and how different — not just a leaderboard.
Eighteen banks are profiled here: 15 U.S. institutions and 3 Canadian institutions, together holding many trillions of dollars in combined assets under one roof.
Every profile follows the same structure — corporate history, financial scale, products and specialties, and reputation and risk — specifically so the banks can be compared side by side.
Total assets alone can mislead: a custodian bank’s assets under custody can dwarf its balance sheet, and a card-focused bank’s customer count can dwarf its branch network.
Several of the largest banks in North America carry active regulatory constraints in 2026, including asset caps and consent orders that materially limit what they can do next.
2025 and 2026 brought a wave of consolidation among these institutions, from Capital One’s acquisition of Discover to Fifth Third’s acquisition of Comerica.
Knowing which bank specializes in what — retail branches, credit cards, investment banking, or custody — matters more for choosing where to bank than knowing which one is technically “biggest.”
Key Numbers to Know
| Metric | Figure | As of |
|---|---|---|
| Federal funds target rate | 3.75%–4.00% | September 16, 2026 (Fed hike) |
| Prime Rate | 7.00% | September 16, 2026 |
| Largest U.S. bank by total assets | JPMorgan Chase, roughly $5.0 trillion | 2026 |
| Largest Canadian bank by total assets | Royal Bank of Canada, roughly CA$2.5 trillion | Fiscal Q3 2026 |
| World’s largest bank custodian by assets under custody/administration | BNY, roughly $59 trillion | FY2025 |
| Largest credit card issuer by purchase volume (post-merger) | Capital One (post-Discover) | 2026 |
| Combined U.S. asset cap still active on a top-18 bank | TD Bank Group (TD Bank N.A. + TD Bank USA N.A.), roughly $434 billion | 2026 |
| Largest 2025–2026 bank M&A deal among these 18 | Capital One–Discover Financial, $35.3 billion | Closed May 2025 |
| Number of the 18 banks with a sitting CEO who also chairs the board | Majority | 2026 |
JPMorgan Chase
JPMorgan Chase & Co. is the largest bank in the United States. By several measures, it’s the largest bank in the world. Run from its Park Avenue headquarters in Manhattan, the firm touches nearly every corner of American financial life — from the debit card in your wallet to the trading desks that move global markets.
The numbers make the case on their own. JPMorgan closed the second quarter of 2026 with $5.02 trillion in total assets. That’s more than any other U.S. bank holds on its balance sheet.
That scale alone would earn a spot on this list. But Chase backs it up with leadership positions across nearly every business line it touches. Under Chairman and CEO Jamie Dimon, the bank has spent two decades building what he calls a “fortress balance sheet.” It’s a strategy that turned a large commercial bank into the most systemically important financial institution in the country. That scale alone makes JPMorgan Chase the natural starting point for any list of the largest banks in North America.
Corporate Profile & History
Founding, Headquarters, and Corporate Structure
JPMorgan Chase trades on the New York Stock Exchange as NYSE: JPM. It runs its global operations from 270 Park Avenue. Its roots, though, go back much further than most people realize.
The company traces its lineage through more than 1,200 predecessor institutions spanning over 225 years. The Manhattan Company started in 1799 as a water utility — Aaron Burr’s creation. It pivoted almost immediately into banking. Drexel, Morgan & Co. formed in 1871, when J. Pierpont Morgan partnered with Anthony Drexel. That partnership eventually became J.P. Morgan & Co.
Two later mergers built the modern firm. Bank of the Manhattan Company combined with Chase National Bank in 1955 to form Chase Manhattan Bank. Then Chase Manhattan merged with J.P. Morgan & Co. in 2000, creating today’s JPMorgan Chase & Co. — a bank holding company designated a U.S. globally systemically important bank.
Major Mergers, Acquisitions, and Milestones
The 2004 merger with Bank One Corp. brought Jamie Dimon into the firm as President and Chief Operating Officer. That move set up his later rise to the top job. Then the 2008 financial crisis turned into a growth opportunity. JPMorgan acquired the collapsing Bear Stearns for roughly $10 a share. It also picked up Washington Mutual’s banking operations from the FDIC for $1.836 billion. Separately, the bank accepted $25 billion in TARP funds, which it later repaid in full.
More recently, in 2023, JPMorgan acquired the failed First Republic Bank from the FDIC. It was the largest U.S. bank-failure resolution since 2008. The growth hasn’t slowed either. In November 2025, the bank unveiled a roughly 3-million-square-foot office expansion in London’s Canary Wharf — bigger than The Shard.
Leadership and Governance
Jamie Dimon holds the combined title of Chairman and CEO, a structure that has defined JPMorgan for two decades. He joined through the Bank One merger in 2004 and became CEO in December 2005. He added the chairman title a year later. That adds up to roughly 20 years running the company.
Succession has become the dominant governance story of 2026. In June, JPMorgan named Doug Petno and Troy Rohrbaugh as co-presidents. The move reshuffled the field of potential Dimon successors after Marianne Lake exited the race. Lake, formerly co-CEO of Consumer & Community Banking, had long been considered a frontrunner. Dimon has said the timing of his own departure is “up to the board,” leaving the question open.
Business Segments and Divisions
JPMorgan organizes around four reporting segments. Consumer & Community Banking covers the retail side most Americans know — branches, Chase-branded credit cards, auto loans, and home lending. The Commercial & Investment Bank houses Markets trading, investment banking, payments, and lending to mid-sized and large corporations. That segment was formed by a 2024 reorganization, and its lending arm runs on a rigorous credit underwriting process before any loan closes.
Asset & Wealth Management adds $5.1 trillion in assets under management as of the second quarter of 2026. That makes it one of the largest wealth and asset managers anywhere. A smaller Corporate segment rounds things out with treasury functions. Together, these four pillars give JPMorgan a genuine claim to being a full-service, universal bank rather than a specialist in any single niche.
Financial Performance & Scale
Total Assets and Balance Sheet Size
Total assets tell you how big a bank truly is. By this measure, JPMorgan sits alone at the top of American banking, with $5.02 trillion in total assets as of June 30, 2026.
That figure didn’t appear overnight. JPMorgan closed FY2025 with $4.42 trillion in total assets. That’s up from $4.00 trillion at the end of FY2024 and $3.88 trillion at the end of FY2023 — roughly 10% annual growth. The pattern reflects organic deposit and loan expansion more than one-off acquisitions.
Annual Revenue and Net Income
JPMorgan’s profitability keeps climbing. Full-year 2025 revenue reached $168.2 billion, with net income of $55.68 billion — slightly below 2024’s $56.87 billion despite the higher revenue. Over the trailing twelve months through Q2 2026, revenue hit $186.3 billion. Net income reached $63.6 billion, a net margin near 34%.
The second quarter of 2026 alone stood out. JPMorgan posted $21.2 billion in net income, the highest quarterly profit in the bank’s history. Diluted earnings per share reached $7.70. Total managed revenue hit $58.0 billion, up 27% year over year, partly boosted by a $4.6 billion gain tied to JPMorgan’s Visa stake. Investment banking fees jumped 30% to $3.3 billion, the best showing since 2021. Management raised its full-year 2026 net interest income guidance to roughly $105.5 billion as a result.
Customer Count and Market Share
Scale shows up in customer counts too. JPMorgan serves 86.6 million U.S. consumers and 7.4 million small businesses, per full-year 2025 figures. It holds the top spot in U.S. retail deposit market share at 11.1% — a title held for five consecutive years. The bank also leads deposit share in four of the five largest U.S. banking markets, including New York, Los Angeles, Chicago, and Dallas.
Chase is the country’s largest credit card issuer too, commanding roughly 24% market share with $248 billion in outstanding card loans. Digital adoption keeps rising: 75 million active digital customers and 62 million active mobile users, up 7% year over year.
Stock Performance and Credit Ratings
JPMorgan’s stock closed at $348.92 on September 16, 2026. That gave the company a market capitalization of roughly $927.5 billion — among the most valuable financial institutions anywhere. Shares have traded between $279.10 and $366.50 over the past 52 weeks, at a trailing price-to-earnings ratio near 14.97.
Credit agencies view the bank favorably, though the picture gets nuanced once you separate the holding company from the operating bank. Moody’s upgraded the holding company’s senior debt to A1. JPMorgan Chase Bank, N.A. carries a higher Aa2 rating on deposits. In May 2025, Moody’s trimmed that bank-level rating one notch after downgrading the U.S. sovereign rating, but kept JPMorgan’s outlook positive — a better outcome than several rivals received in the same round. S&P rates the bank subsidiary around A+, and Fitch rates it around AA.
Products, Services & Specialties
Core Banking Products
For everyday customers, JPMorgan operates under the Chase brand. That means Chase Total Checking accounts, savings products, and the widely recognized Sapphire and Freedom credit card lines. Beyond cards, the bank offers auto loans, mortgages, and home lending through its Consumer & Community Banking segment.
Anyone comparing rewards structures across issuers benefits from understanding credit card basics first. That knowledge helps before choosing between a premium Sapphire-tier card and a simpler cash-back option. Chase offers products at both ends of that spectrum, along with dedicated small-business banking and lending.
Specialty Divisions and Niche Strengths
Investment banking is where JPMorgan separates itself most from competitors. The firm ranks as the #1 global investment bank by fees in most league tables. Its Markets division posted an 86% year-over-year jump in equities revenue during the second quarter of 2026.
Asset & Wealth Management adds another dimension, overseeing $5.1 trillion in assets under management. That scale puts JPMorgan among the largest wealth managers globally, not just among banks. Combine that with the #1 credit card issuer position and #1 retail deposit share, and you get a rare combination. JPMorgan leads simultaneously in consumer, institutional, and wealth management. Few competitors match that breadth across all three fronts at once.
Digital Banking and Technology
JPMorgan’s digital investment shows up in independent rankings, not just internal metrics. The Chase mobile app ranked #1 among national banks in the J.D. Power 2026 U.S. Mobile Banking App Satisfaction Study, announced in May 2026. Reviewers cited particularly strong scores for design and system performance. The app now serves nearly 63 million active mobile users.
Chase also topped the J.D. Power 2026 Mortgage Servicer Satisfaction Study the same year. That’s a signal worth noting. The bank’s technology spending is translating into experiences customers actually notice, not just internal metrics that look good on paper.
Fees, Rates, and Customer Experience
Independent fee-schedule data for Chase’s checking and overdraft policies wasn’t available in the sourcing for this profile. We won’t cite specific figures here rather than guess. What the research does confirm is customer sentiment. Back-to-back J.D. Power #1 rankings in mobile banking and mortgage servicing suggest something real. The friction points customers notice most — app usability and loan servicing — are areas where Chase currently outperforms rather than lags peers.
Reputation, Risks & Recent Developments
Regulatory History and Compliance Record
No bank JPMorgan’s size gets through two decades without regulatory scars, and Chase has accumulated plenty. In 2013, the bank paid roughly $13 billion to settle claims tied to mortgage-backed-securities misconduct from the financial crisis. A year later, it paid $2.05 billion over failing to flag suspicious activity connected to Bernie Madoff’s Ponzi scheme.
More recent cases add to the list. A $920 million multi-agency settlement in 2020 covered spoofing in precious-metals and Treasury markets. A 2023 settlement — $290 million plus a separate $75 million payment to the U.S. Virgin Islands — addressed the bank’s ties to Jeffrey Epstein’s trafficking operation. In March 2024, the OCC and Federal Reserve jointly fined JPMorgan $348.2 million over trade-surveillance gaps spanning nearly a decade. The OCC portion of that order was formally terminated in March 2026. The companion Federal Reserve order reportedly remains active.
Competitive Position and Differentiation
JPMorgan’s edge comes down to breadth. It’s the largest U.S. bank by assets. As of 2026, it’s also among the largest banks anywhere by market capitalization, with Dimon’s “fortress balance sheet” framing serving as the bank’s signature strategic narrative.
What differentiates JPMorgan from most rivals isn’t any single business line. It’s leading in nearly all of them at once. The bank sits at #1 in consumer deposits, #1 in credit cards, and near the top of investment banking and asset management — a breadth of dominance few universal banks anywhere can match.
Recent News and 2026 Developments
Succession dominates the JPMorgan storyline heading into 2027. Marianne Lake’s exit from the CEO race reshuffled the field of contenders. So did the June 2026 appointment of Doug Petno and Troy Rohrbaugh as co-presidents. Both moves point toward eventually replacing Jamie Dimon, who has offered no firm timeline for stepping down.
Politics has intruded too. Reports surfaced in January 2026 of a $5 billion lawsuit filed by Donald Trump against JPMorgan and Dimon personally. In February 2026, the bank acknowledged having closed a Trump-linked account back in 2021. That disclosure drew fresh scrutiny over allegations of politically motivated “debanking.”
On the growth side, Chase is expanding its physical footprint even as digital banking grows. More than 160 new U.S. branches are opening across 30-plus states in 2026. That adds to a network already covering all 48 contiguous states.
Strengths, Weaknesses, and Who This Bank Suits
JPMorgan’s strengths are hard to argue with. Unmatched scale, simultaneous leadership across consumer banking, credit cards, and investment banking, and consistently the highest profitability among large U.S. banks. Its mobile app and mortgage servicing both earned top J.D. Power honors in 2026.
The weaknesses are equally real. JPMorgan’s regulatory history spans trading-surveillance failures, mortgage-securities misconduct, and Epstein-related litigation. That pattern keeps the bank under continuous political and regulatory scrutiny simply because of its size.
This bank suits customers who want a full-service national relationship. Think the broadest branch and ATM network in the country, a top-ranked app, and premium card products like the Sapphire lineup. It’s also the default choice for large corporations and institutions needing top-tier investment banking or asset management. Fee-sensitive customers wanting a stripped-down, community-bank feel will likely find better fits elsewhere. Weigh those trade-offs carefully: JPMorgan Chase is the single largest of the largest banks in North America, but size alone doesn’t guarantee the best fit for every customer.
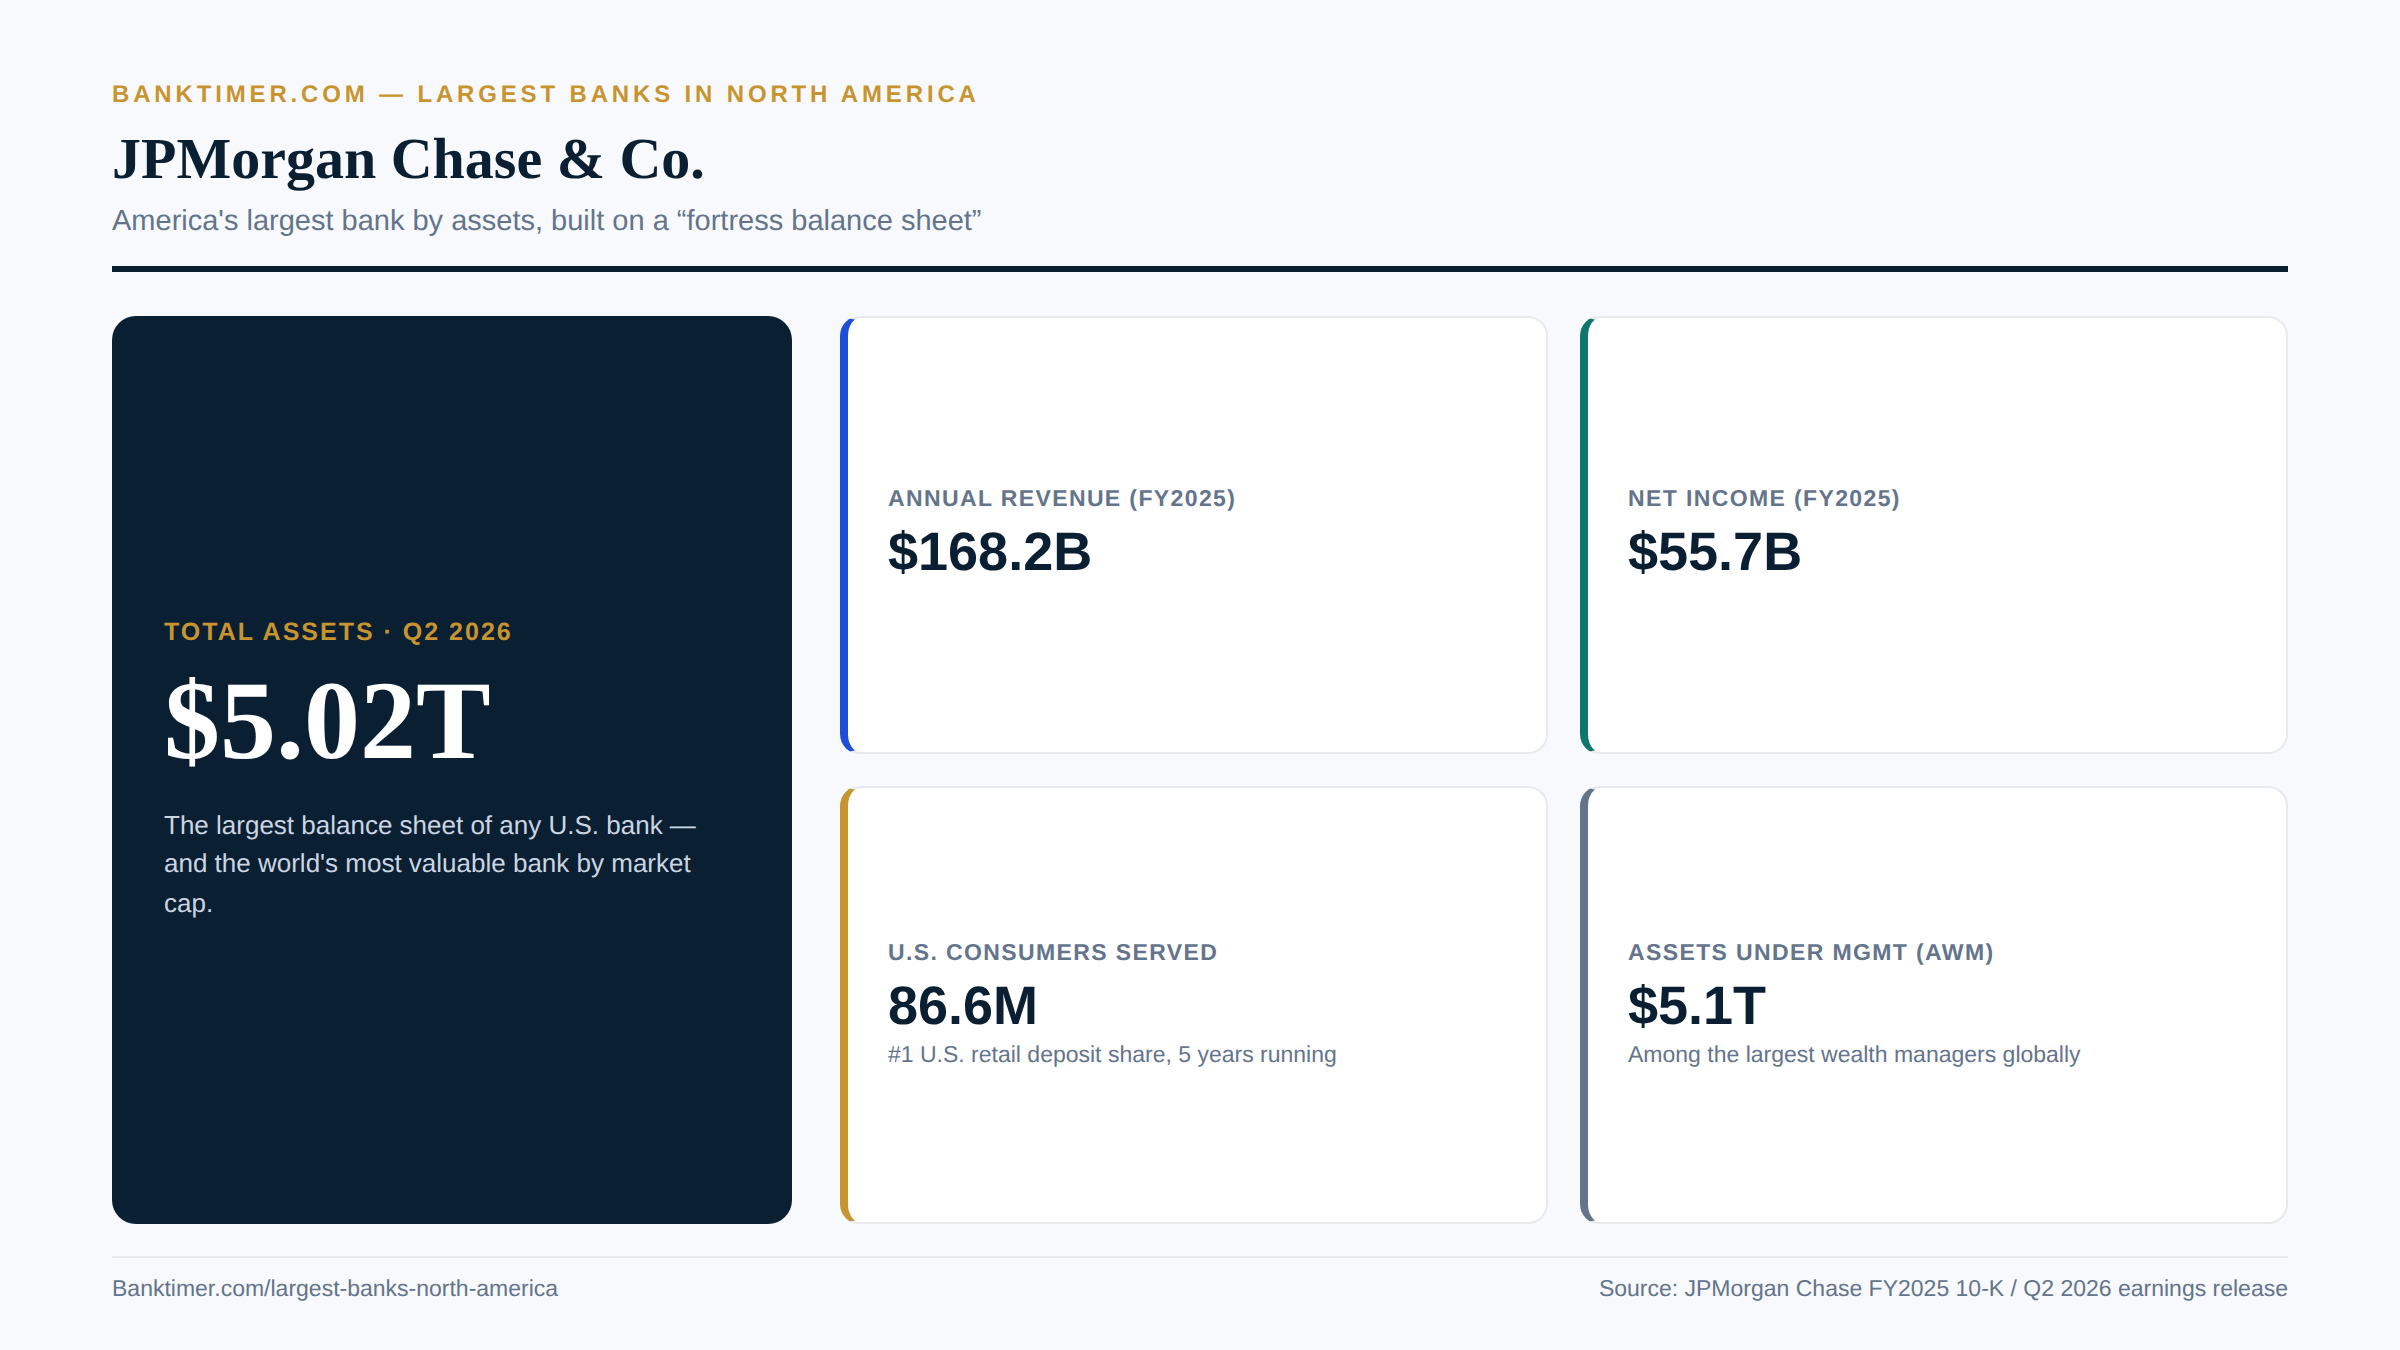
America’s biggest bank, by the numbers: $5.02 trillion and counting
Bank of America
Bank of America traces its identity to two very different places. One is a small immigrant-focused bank in San Francisco. The other is the aggressive growth story that built modern Charlotte into a banking capital. That combination still shapes how the company operates today.
By total assets, Bank of America is the second-largest bank in the United States. It holds roughly $3.50 trillion on its balance sheet as of the second quarter of 2026, trailing only JPMorgan Chase.
What earns Bank of America a spot on this list isn’t just size, though. It’s the unusual breadth of its franchise. A coast-to-coast retail branch network sits alongside Merrill, one of the most recognized wealth-management brands in the country. Add a genuinely large institutional trading business, and you get a bank that serves both a Main Street checking customer and an ultra-high-net-worth family under one roof — something few competitors manage this effectively. Few of the largest banks in North America combine that much retail reach with that much wealth-management horsepower.
Corporate Profile & History
Founding, Headquarters, and Corporate Structure
Bank of America trades as NYSE: BAC. It’s headquartered at the Bank of America Corporate Center in Charlotte, North Carolina — a somewhat surprising home base for a company whose roots run through San Francisco.
The story starts in 1904. Amadeo Pietro Giannini founded the Bank of Italy specifically to serve working-class immigrants and farmers that elite, established banks largely ignored. That mission became visible after the 1906 San Francisco earthquake. Giannini’s bank extended loans to help rebuild the city while larger rivals hesitated.
The modern holding company took shape in 1998. NationsBank of Charlotte, led by Hugh McColl, acquired Bank of America and kept its name. That deal created the first true coast-to-coast U.S. bank.
Major Mergers, Acquisitions, and Milestones
Two 2008 deals defined the bank’s modern risk profile more than any other event in its history. Bank of America acquired Countrywide Financial for roughly $4 billion, a deal that closed in January 2008. Countrywide was the country’s largest subprime mortgage originator. The deal proved catastrophic — Countrywide-related settlements and penalties ultimately cost Bank of America an estimated $40 billion.
That same year, the bank also acquired Merrill Lynch for approximately $50 billion. The deal was struck at the height of the financial crisis and partly encouraged by government pressure. Whatever the circumstances, it gave Bank of America the wealth-management and investment-banking franchise it still relies on today.
More recently, in August 2026, Bank of America entered a joint venture with Jio Financial Services. The deal lets it acquire up to a 49.9% stake in Jio Credit, an Indian lender, for approximately $1.9 billion.
Leadership and Governance
Brian Moynihan has served as Chair and CEO since January 1, 2010. That’s roughly 16 years in the role as of 2026, one of the longer tenures among major U.S. bank chiefs. Like Jamie Dimon at JPMorgan, Moynihan holds both titles at once.
That combined structure hasn’t gone unchallenged. Shareholders have voted on proposals to separate the CEO and board chair roles, and rejected them. They chose instead to keep governance concentrated under Moynihan. It’s a pattern that holds across most of the largest U.S. banks, despite periodic investor pushback.
Business Segments and Divisions
Bank of America organizes around four segments, and its second-quarter 2026 results show a bank firing on every cylinder. Consumer Banking posted $3.3 billion in net income, up 10% year over year, with a 29% return on allocated capital.
Global Wealth & Investment Management combines the Merrill and Bank of America Private Bank businesses. It posted $1.4 billion in net income, up 42%, while managing $4.9 trillion in client balances. Global Banking added $2.0 billion in net income as investment banking fees jumped 50% for the quarter. Global Markets contributed $2.6 billion, up 72%, on a 33% jump in sales and trading revenue.
Every segment grew at once that quarter — a pattern that’s harder to pull off than it sounds.
Financial Performance & Scale
Total Assets and Balance Sheet Size
Bank of America closed the second quarter of 2026 with roughly $3.50 trillion in total assets. That’s the second-largest balance sheet of any U.S. bank, behind JPMorgan Chase. The scale has built steadily: $3.41 trillion at the end of FY2025, up from $3.26 trillion in FY2024, $3.18 trillion in FY2023, and $3.05 trillion in FY2022.
Four straight years of asset growth, without a major acquisition driving the increase, points to something specific. Organic deposit and loan growth, not one-time balance-sheet inflation, is doing the work — a healthier pattern than relying on M&A to pad the numbers.
Annual Revenue and Net Income
Bank of America’s FY2025 results, per its 10-K, showed revenue of $107.4 billion and net income of $29.06 billion. Some secondary sources cite $113.1 billion in revenue and $30.5 billion in net income using a different reporting convention. The 10-K figures are more authoritative for comparison purposes.
The growth trajectory is clear either way. FY2024 revenue was $100.0 billion with net income of $25.34 billion. FY2023 revenue was $98.4 billion with net income of $24.66 billion. Trailing-twelve-month revenue through Q2 2026 reached $113.9 billion, with net income of $32.1 billion.
The most recent quarter, reported July 14, 2026, beat expectations across the board. Net income hit $9.1 billion, up 27% year over year. Diluted earnings per share reached $1.21, an 8% beat versus consensus. Total revenue reached $31.6 billion, up 15%, and return on tangible common equity climbed to 17.0%.
Customer Count and Market Share
Bank of America serves close to 70 million consumer, small-business, and institutional clients globally. That includes more than 69 million consumer and small-business relationships specifically. On the corporate side, the bank counts 78% of the Global Fortune 500 and 96% of the U.S. Fortune 1,000 as clients.
It’s also the country’s #1 small-business lender, serving 4 million small businesses. Deposits totaled $2.03 trillion as of June 30, 2026, including $953.2 billion within Consumer Banking. The bank holds more than 10% of all FDIC-insured deposits nationwide.
Digital adoption keeps climbing too. Active digital banking users reached 49.8 million, and active mobile users hit 42.1 million, with mobile now accounting for 84.4% of active digital usage. More than 25.5 million customers actively use Zelle through the bank’s app.
Stock Performance and Credit Ratings
Bank of America’s stock closed at $57.90 on September 16, 2026, valuing the company at roughly $404.9 billion. Shares have ranged between $46.12 and $65.23 over the past 52 weeks.
The stock dipped after the bank flagged a warning at a Barclays conference. Third-quarter 2026 investment-banking fees could fall at least 10%, the bank said, while trading revenue stays roughly flat — a forward-looking caution worth watching.
Credit ratings tell a similarly mixed story. Moody’s upgraded the holding company’s senior debt to A1. The bank subsidiary carries a higher Aa2 rating on deposits. But in May 2025, following the U.S. sovereign downgrade, Moody’s cut that bank-level rating one notch. It also moved Bank of America’s outlook from negative to stable — a less favorable result than JPMorgan received in the same review. S&P rates the bank subsidiary around A+, and Fitch rates it around AA.
Products, Services & Specialties
Core Banking Products
Bank of America’s retail lineup runs through its Consumer Banking segment. That means checking and savings accounts, credit cards, auto loans, and home lending. Small-business banking is a particular strength, backed by the bank’s #1 U.S. small-business lender status.
Anyone weighing a joint bank account against a solo one should work through the trade-offs first, whether they’re banking here or with a competitor. It’s a common decision point for couples and family-run small businesses alike.
Specialty Divisions and Niche Strengths
Merrill is Bank of America’s crown jewel. Combined with Bank of America Private Bank under the Global Wealth & Investment Management umbrella, the two businesses manage $4.9 trillion in client balances. That’s a wealth franchise that rivals any competitor’s, including dedicated wealth managers with no retail banking business at all.
On the institutional side, Global Banking and Global Markets lean on deep corporate relationships. The trading business alone posted 72% net income growth in the second quarter of 2026.
There’s a lesser-known niche worth mentioning too. BofA Merchant Services, the bank’s payment-processing arm, ranked #1 by J.D. Power for customer satisfaction in the 2026 U.S. Merchant Services Satisfaction Study.
Digital Banking and Technology
Bank of America’s AI assistant, Erica, shows how effectively a bank can deploy conversational AI at scale. Launched in 2018, Erica logged 20.6 million users in 2025. It generated roughly 700 million interactions that year and more than 3.2 billion cumulative interactions since launch.
That’s just the visible layer of a broader push. Client digital interactions reached roughly 30 billion in the period reported, up 14% year over year. That included 16.6 billion logins and 13.3 billion alerts sent, with more than 38 million customers now subscribing to alerts.
The bank says 94% of client interactions now happen digitally. And 86% of clients rate their digital experience 9 or higher out of 10. None of that comes cheap: Bank of America spends roughly $14 billion annually on technology, including $4.1 billion for new initiatives like AI.
Fees, Rates, and Customer Experience
The clearest sourced customer-experience data point for Bank of America is its #1 J.D. Power ranking in merchant services for 2026, noted above. Independent fee-schedule and general-banking satisfaction data for checking accounts wasn’t conclusively available for this profile. So we won’t cite specific overdraft or maintenance-fee figures here. What is clear is that Bank of America has invested heavily in digital self-service tools. That tends to reduce the everyday friction that drives most banking complaints.
Reputation, Risks & Recent Developments
Regulatory History and Compliance Record
Bank of America’s regulatory history includes some of the largest settlements in U.S. banking. In 2014, the bank paid $16.65 billion to the Department of Justice over risky mortgage-backed-securities sales. It was one of the largest corporate settlements in American history at the time. In 2011, it paid $335 million over discriminatory lending practices tied to Countrywide.
The more recent case is arguably more damaging to reputation. Regulators explicitly called Bank of America a repeat offender. In July 2023, the CFPB and OCC jointly fined the bank $250 million for three practices: double-charging $35 overdraft fees on the same insufficient-funds transaction, illegally withholding advertised credit-card signup rewards, and opening unauthorized accounts to hit sales targets dating back to at least 2012. That penalty followed a $727 million settlement in 2014 and $235 million in fines during 2022.
Competitive Position and Differentiation
As the second-largest U.S. bank by assets, Bank of America occupies a distinct lane. It combines a genuinely large retail branch and ATM network with a top-tier wealth-management arm in Merrill. That “mass affluent to ultra-high-net-worth” bridge is hard for most competitors to replicate at this scale. Chase leads in raw consumer deposit share, but Bank of America’s wealth franchise gives it a different kind of depth.
The bank has also made AI and digital investment a public differentiator. It leans hard on Erica’s usage numbers in its own investor materials. Whether that translates into new customer wins, or simply better retention, is harder to measure from the outside.
Recent News and 2026 Developments
Bank of America’s most significant 2026 move outside the U.S. is the August joint venture with Jio Financial Services. The deal gives the bank up to a 49.9% stake in Jio Credit for approximately $1.9 billion. In March 2026, the bank also recruited four senior technology-sector bankers to expand its tech-focused deal-making.
Not every recent signal points up, though. At a Barclays conference in September 2026, Bank of America flagged that third-quarter investment-banking fees could drop at least 10% quarter over quarter. Trading revenue, meanwhile, looks roughly flat.
The branch network is quietly shrinking even as digital banking grows. Bank of America operated 3,530 retail financial centers as of June 30, 2026, down 134 locations from a year earlier. Its ATM network, though, grew slightly to 14,939 machines — a genuinely branch-light, digital-first trajectory.
Strengths, Weaknesses, and Who This Bank Suits
Bank of America’s strengths center on breadth and execution. A massive balance sheet pairs with a genuinely strong wealth-management franchise in Merrill. Add the #1 small-business lender title, heavy and apparently effective AI investment through Erica, and a #1 J.D. Power ranking in merchant services.
Its weaknesses cluster around a specific, recurring theme: consumer-fee practices. Regulators have repeatedly flagged overdraft “double-dipping,” withheld card rewards, and unauthorized account openings. They explicitly labeled the bank a repeat offender in 2023. Add a shrinking branch network, even as Chase expands its own, and the picture looks more mixed than the headline numbers suggest.
This bank suits customers who want one relationship spanning everyday retail banking all the way to Merrill-level wealth management. It also suits small-business owners drawn to its #1 lender status. Customers who’ve been burned by fee disputes before may want to look elsewhere first. That balance of scale and reach is a big part of why Bank of America stays near the top of the largest banks in North America.
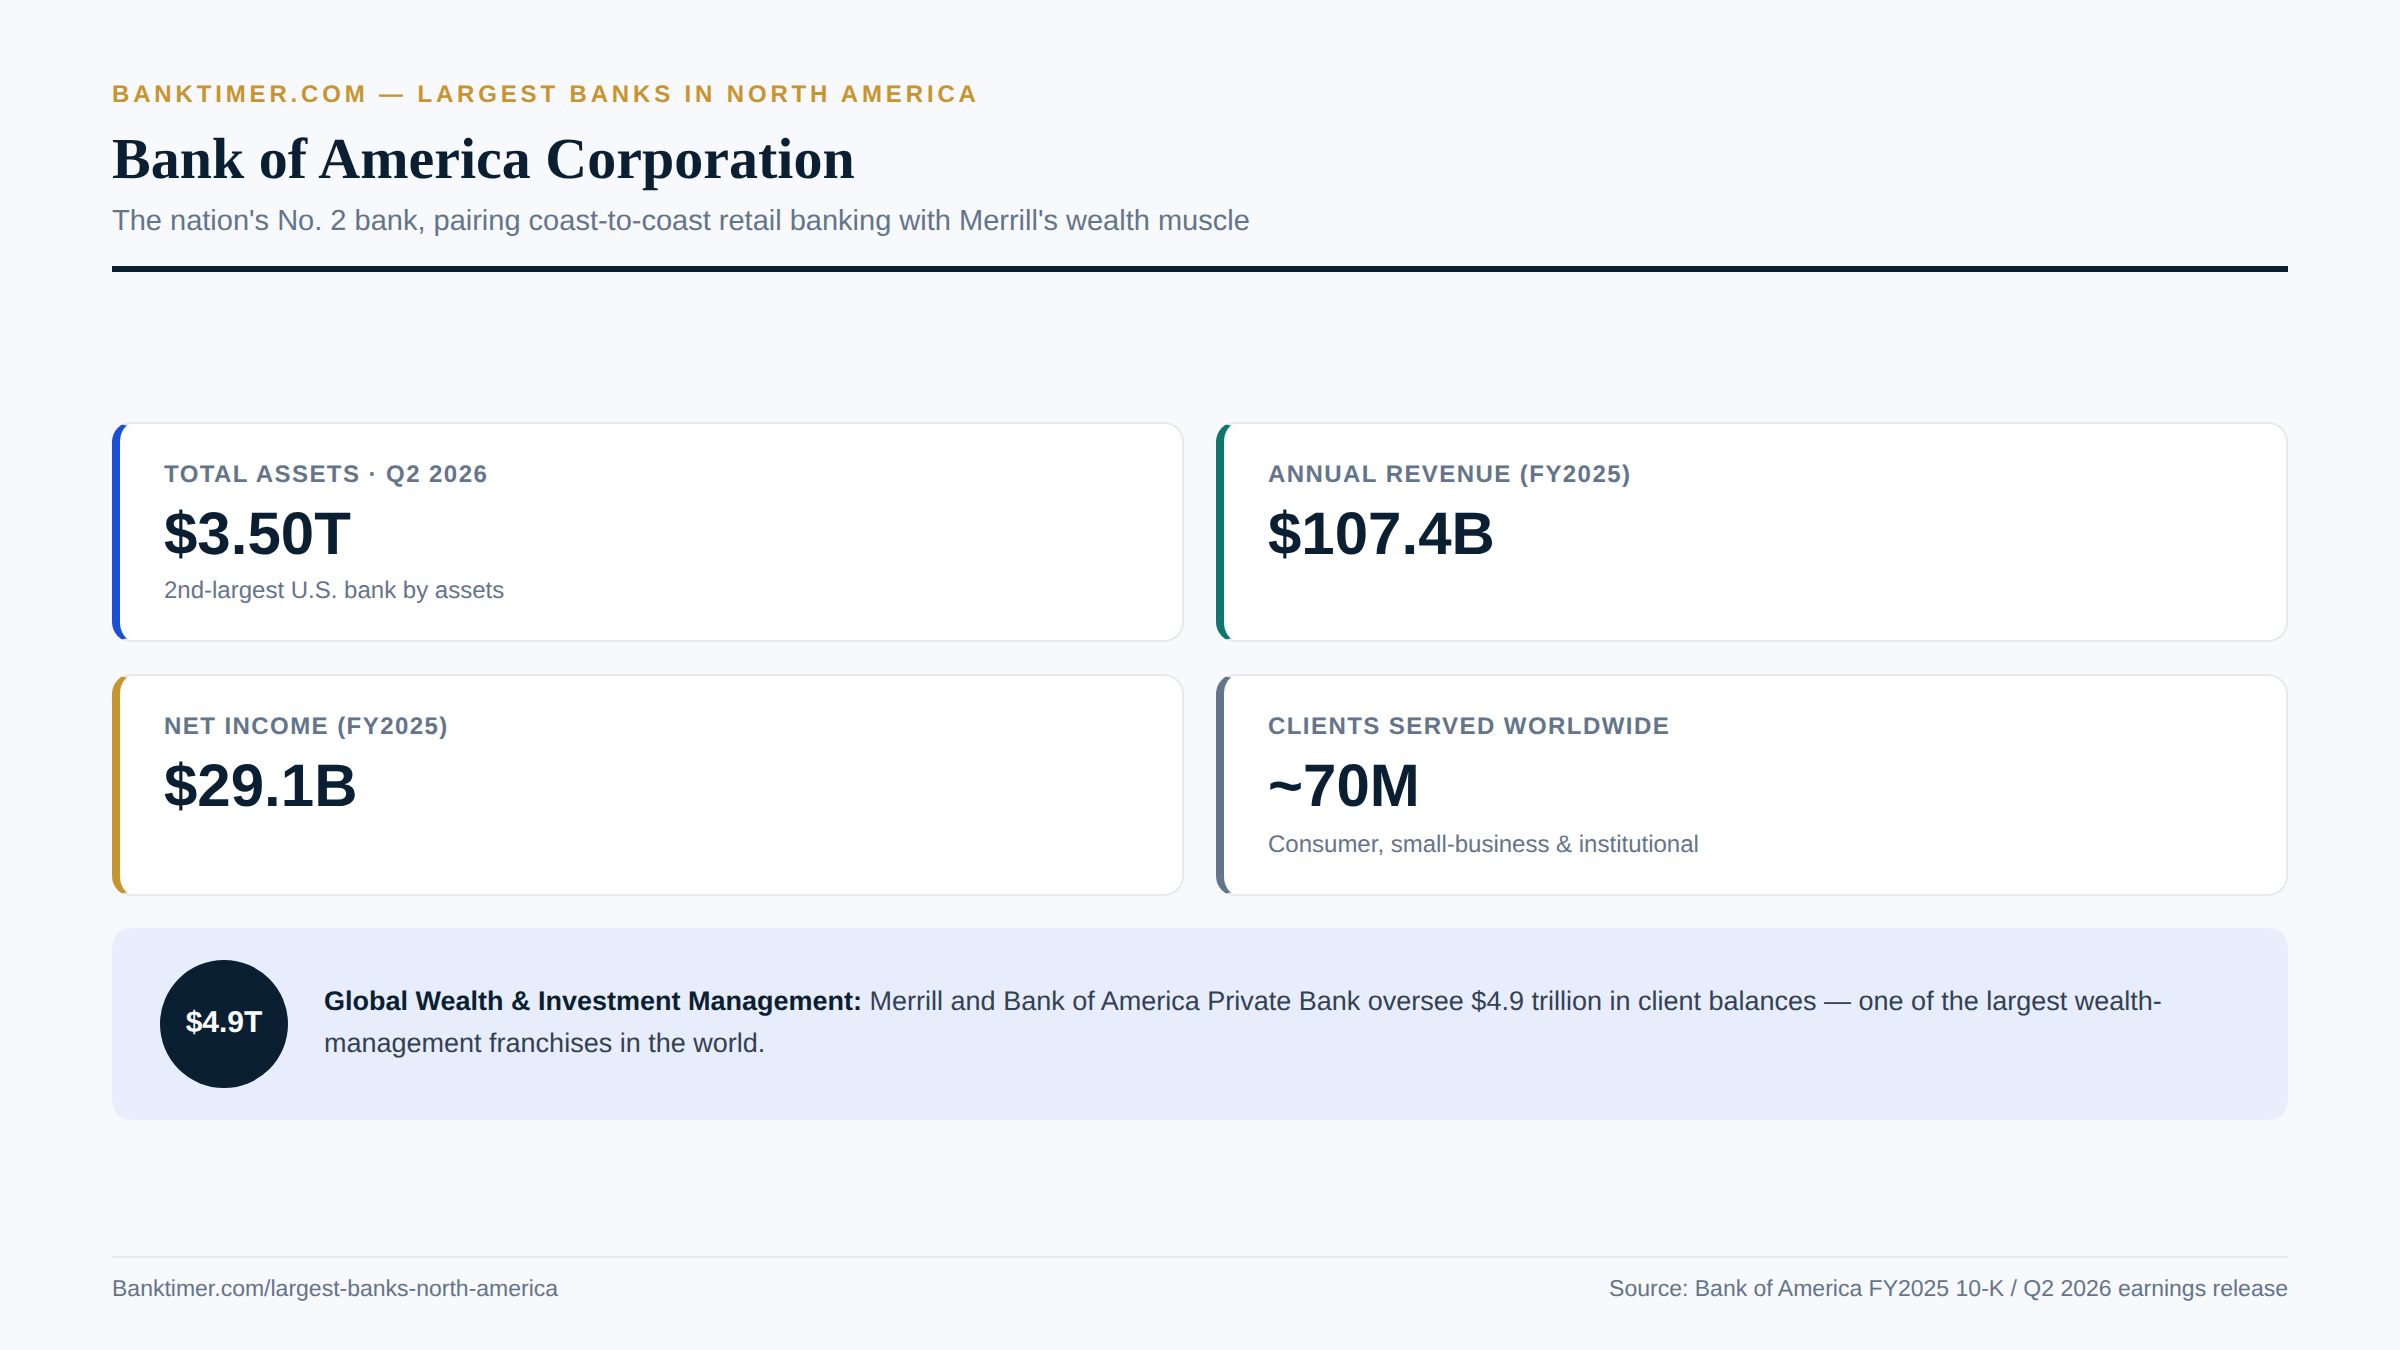
#2 by assets, #1 in wealth muscle: BofA’s $4.9 trillion Merrill machine
Citigroup
Citigroup is the most global of the three banks in this cluster. It operates in far more countries than its more domestically focused peers ever attempt to reach directly. That international footprint, built over two centuries, is both the bank’s greatest strength and the reason it looks so different from JPMorgan or Bank of America.
By total assets, Citigroup is the smallest of the “big three” money-center banks. It closed the second quarter of 2026 with roughly $2.89 trillion on its balance sheet — still an enormous number, just smaller than its two larger peers.
What makes Citi worth including here isn’t sheer size. It’s the bank’s structural position as a global transaction-banking leader, moving vast sums of money across borders daily for corporations that need exactly that kind of reach. Under CEO Jane Fraser, Citi has spent recent years narrowing its focus. It has shed international consumer franchises to double down on the businesses where it actually leads. Even mid-transformation, Citigroup’s global network keeps it firmly ranked among the largest banks in North America.
Corporate Profile & History
Founding, Headquarters, and Corporate Structure
Citigroup trades as NYSE: C from its headquarters at 388 Greenwich Street in New York City. Its history stretches back further than either JPMorgan’s or Bank of America’s most direct predecessors. It was chartered as City Bank of New York on June 16, 1812, with Samuel Osgood as its first president.
The name changed twice over the following century. A 1955 merger with First National Bank created First National City Bank. That entity was renamed Citibank in 1976, under a new parent, Citicorp. The defining moment came on October 8, 1998, when Citicorp merged with Sandy Weill’s Travelers Group to form the modern Citigroup. At the time, it was the largest financial-services company in the world, spanning banking, insurance, and brokerage. Today, Citi operates in more than 180 countries and jurisdictions — by far the most extensive footprint in this cluster.
Major Mergers, Acquisitions, and Milestones
The 1998 Citicorp-Travelers merger remains Citigroup’s defining corporate event. The company later spun off Travelers’ insurance operations in 2002, once the conglomerate model fell out of favor. Since then, especially through the 2020s, Citi has run in the opposite direction. It has systematically divested international consumer-banking franchises as part of CEO Jane Fraser’s simplification strategy.
Recent moves reflect that focus. In 2025, Citi agreed to sell its wealth-alternatives unit, Citi Global Alternatives, to iCapital. In November 2025, the bank integrated its U.S. retail banking operations directly into its wealth-management business, aiming for a seamless retail-to-wealth client experience. The long-running separation of Citi’s Mexican consumer business, Banamex, has also continued, though its exact 2026 status wasn’t independently confirmed for this profile.
Leadership and Governance
Jane Fraser has served as CEO since 2021. As of October 22, 2025, she also holds the title of Board Chair, combining both roles — similar to Jamie Dimon at JPMorgan and Brian Moynihan at Bank of America. Unlike those two banks, Citi retained a check on that combined authority. John Dugan, chair since 2019, moved into a Lead Independent Director role rather than leaving the board. He continues to oversee succession planning, shareholder relations, and the bank’s Transformation Oversight Committee.
The board’s confidence in Fraser’s direction showed up financially too. She received a one-time award of $25 million in restricted stock units plus 1.055 million stock options, vesting over five years. The award was tied to her progress completing divestitures and advancing Citi’s transformation program.
Business Segments and Divisions
Citigroup now runs five core operating segments, replacing its older two-segment model. Services houses Treasury & Trade Solutions and Securities Services. It’s Citi’s single most profitable business, posting $2.584 billion in net income in the second quarter of 2026 alone — Citi’s global transaction-banking leadership on full display.
Markets, covering equities and fixed-income trading, added $2.387 billion in net income the same quarter. Banking, Citi’s investment-banking and corporate-banking arm, contributed a comparatively modest $350 million. Wealth, now integrated with U.S. retail banking, added $583 million. U.S. Personal Banking, which houses Citi’s branded credit cards and retail deposits, posted $852 million.
A residual “All Other” category, covering legacy franchises, posted a $923 million net loss that quarter. It’s a reminder that Citi’s simplification still carries real costs.
Financial Performance & Scale
Total Assets and Balance Sheet Size
Citigroup ended the second quarter of 2026 with roughly $2.89 trillion in total assets — the smallest balance sheet of the three banks compared here, though it’s growing quickly. FY2025 year-end assets reached $2.66 trillion, up from $2.35 trillion at the end of FY2024, a roughly 13% jump.
That growth rate outpaces both JPMorgan’s and Bank of America’s recent asset expansion, even from a smaller base. It’s consistent with the broader turnaround story under Jane Fraser.
Annual Revenue and Net Income
Citigroup’s improvement over the past three years is the sharpest of any bank in this cluster. FY2025 revenue reached $75.7 billion, with net income of $13.02 billion. That’s nearly double the $7.85 billion Citi reported for FY2023, when revenue was $70.3 billion. FY2024 landed in between, at $70.9 billion in revenue and $11.46 billion in net income.
The momentum carried into 2026. Trailing-twelve-month revenue through Q2 2026 reached $81.7 billion, with net income of $16.46 billion. The second quarter itself, reported July 14, 2026, was Citi’s best quarterly showing in years. Net income hit $5.83 billion, up 45% year over year — the fastest growth rate of the three banks. Earnings per share reached $3.15, beating estimates. Revenue hit $24.77 billion, up 14%, which Citi itself called its best quarterly revenue in a decade. The bank also announced a 12% dividend increase alongside a $30 billion share buyback program.
Customer Count and Market Share
Citigroup’s customer base looks fundamentally different from JPMorgan’s or Bank of America’s. Rather than tens of millions of retail relationships, Citi serves roughly 19,000 institutional clients worldwide, with relationships spanning 85% of the Fortune 500. Its Services franchise reportedly moves financial flows approaching $6 trillion daily across global markets. That’s a genuine leadership position in cross-border transaction banking that neither JPMorgan nor Bank of America matches internationally.
On the consumer side, Citi’s U.S. retail footprint is deliberately small: roughly 650 branches, concentrated in just six wealthy urban markets, including New York and Miami. That’s a strategic choice. Citi serves dense, affluent markets rather than competing branch-for-branch nationally against Chase’s 5,000-plus locations or Bank of America’s 3,500-plus.
Stock Performance and Credit Ratings
Citigroup’s stock closed at $132.95 on September 16, 2026, valuing the company at roughly $223.0 billion. That’s the smallest market cap of the three banks, but also the one with the strongest recent momentum, up approximately 21.4%. Shares have traded between $93.66 and $147.96 over the past 52 weeks.
Credit ratings are where Citi’s turnaround story hits a real limit, at least for now. Per Citi’s own official ratings table dated July 14, 2026, Moody’s rates the holding company A3 with a stable outlook. S&P rates it BBB+ with a stable outlook, and Fitch rates it A with a positive outlook. Those ratings sit meaningfully below JPMorgan’s and Bank of America’s holding-company tiers, which cluster around A1/A-/AA-. The operating bank subsidiary, Citibank, N.A., carries higher ratings — Moody’s Aa3, S&P A+, Fitch A+ — but the holding-company gap remains a real difference from its two larger peers.
Products, Services & Specialties
Core Banking Products
Citi’s U.S. Personal Banking segment centers on branded credit cards. It’s the bank’s largest consumer product line by net income after Services and Markets. Retail checking and savings are concentrated in that roughly 650-branch, six-metro footprint. Since November 2025, retail banking operates jointly with Citi’s wealth business rather than as a separate unit.
Shoppers comparing Citi’s cards against competitors will find it helpful to understand credit card basics first. Citi’s card business remains meaningfully profitable, even as the bank’s overall U.S. retail footprint stays deliberately small next to Chase or Bank of America.
Specialty Divisions and Niche Strengths
Services, combining Treasury & Trade Solutions with Securities Services, is Citigroup’s genuine crown jewel. It posted $2.584 billion in net income in the second quarter of 2026 alone. Citi is widely regarded as a top global player in cross-border cash management and trade finance, serving corporations across more than 180 countries — a scale advantage neither JPMorgan nor Bank of America replicates internationally.
Markets adds a second strength. Equities trading revenue rose 45% year over year in the same quarter, reflecting a strong institutional trading franchise serving clients globally.
Citi’s ongoing simplification shows up here too. The 2025 sale of its wealth-alternatives unit to iCapital reflects a deliberate move toward higher-return, less capital-intensive wealth products, rather than competing on every front at once.
Digital Banking and Technology
Citi is committing $5 billion in incremental firmwide investment through 2028. The money funds AI-driven tools for its newly integrated retail-and-wealth business, along with branch renovations in its core urban markets.
That’s a meaningful bet, though it’s worth being upfront about one gap. A specific Citi mobile-app ranking in J.D. Power’s 2026 banking studies wasn’t conclusively found in the sourcing for this profile, unlike Chase’s confirmed #1 placement. Rather than assert an unverified ranking, it’s fairer to say Citi’s digital strategy is still in an earlier, more visibly ambitious investment phase than Chase’s — whose technology spending has already translated into independently measured customer-satisfaction wins.
Fees, Rates, and Customer Experience
Citi’s U.S. retail approach explicitly rejects mass-market fee competition. Instead of trying to out-discount Chase or Bank of America, the bank is repositioning existing branches around an advisory-focused model. It has hired more than 400 personal bankers and client advisors, along with over 200 small-business advisors.
Kate Luft, who heads Citi’s U.S. retail banking, put it plainly: “Our biggest opportunity is not by acquiring a ton of new clients. We are where we want to be.” She’s pointed to an estimated $3 trillion in untapped revenue potential within Citi’s existing client base. It’s a strategy built on deepening relationships with current customers, not chasing new account volume.
Reputation, Risks & Recent Developments
Regulatory History and Compliance Record
Citigroup’s regulatory story runs longer, and sits more centrally in its current strategy, than either JPMorgan’s or Bank of America’s. In 2014, the bank paid $7 billion to settle claims over mortgage-backed-securities misrepresentation tied to the financial crisis. The more consequential episode came in 2020, after Citi mistakenly sent $900 million to Revlon’s lenders. That error exposed serious internal-control weaknesses. The OCC and Federal Reserve jointly fined Citi $400 million and issued consent orders citing deficiencies in data governance and risk management.
Those orders haven’t fully closed. In July 2024, the OCC filed an amended consent order over continued data-quality shortfalls. It also fined Citi an additional $136 million for violating the original 2020 order. The bank made real progress since then — the OCC terminated that amended order in December 2025. But two original 2020 consent orders, one from the OCC and one from the Federal Reserve, remain active. Citi spent nearly $3.5 billion on risk-management remediation in 2025 alone, and CFO Mark Mason says the bank is “roughly two-thirds” complete on its remediation targets.
Competitive Position and Differentiation
Citi’s competitive position is genuinely different from JPMorgan’s or Bank of America’s. It’s the most globally oriented of the three, operating in over 180 countries versus its peers’ far more U.S.-centric retail scale. Its Services franchise is a structural moat in cross-border transaction banking that smaller, domestic-focused banks can’t replicate.
The flip side is equally clear. Citi is the smallest of the three by assets, market cap, and U.S. retail footprint — 650 branches versus JPMorgan’s 5,000-plus and Bank of America’s 3,500-plus. It also carries the lowest credit ratings of the group. That positions Citi less as a mass-market consumer bank and more as a global wholesale and institutional specialist.
Recent News and 2026 Developments
Governance changed meaningfully at Citi in the past year. Jane Fraser was elevated to Board Chair in October 2025, alongside her existing CEO role, and John Dugan shifted to Lead Independent Director. That restructuring coincided with continued workforce reductions tied to Fraser’s transformation program, including reports of managing-director-level layoffs in March 2026. Exact current headcount figures weren’t independently confirmed for this profile, beyond older 2024 data showing roughly 229,000 employees.
On the regulatory front, the OCC’s December 2025 termination of the amended 2024 consent order counts as a genuine positive development. Strategically, the November 2025 integration of U.S. retail banking into the Wealth business reflects continued simplification. So does the ongoing Citi Global Alternatives sale to iCapital. Both moves came paired with a 12% dividend increase and a new $30 billion buyback authorization.
Strengths, Weaknesses, and Who This Bank Suits
Citigroup’s strengths are concentrated but real. Best-in-class global transaction banking runs through its Services segment. The bank shows the fastest-improving profitability trend of the three, with net income nearly doubling from FY2023 to FY2025. It also has the strongest recent stock momentum, up roughly 21% by market cap. Fraser’s turnaround strategy has a clear, focused direction, rather than trying to be everything to everyone.
The weaknesses track closely with that same turnaround-in-progress story. Citi carries the lowest credit ratings of the three banks. Its consent-order history around data governance and risk management dates back to 2020 and still isn’t fully resolved. Its U.S. retail footprint — just 650 branches in six metro areas — makes it a non-option for most Americans as a primary bank.
Citi suits multinational corporations needing global transaction banking across 180-plus countries. It also suits affluent urban consumers within its six core U.S. markets, and investors willing to bet on a turnaround still underway. Everyday consumers outside those six metros will find better everyday banking options elsewhere. Citigroup’s global reach keeps it in the conversation among the largest banks in North America, turnaround or not.
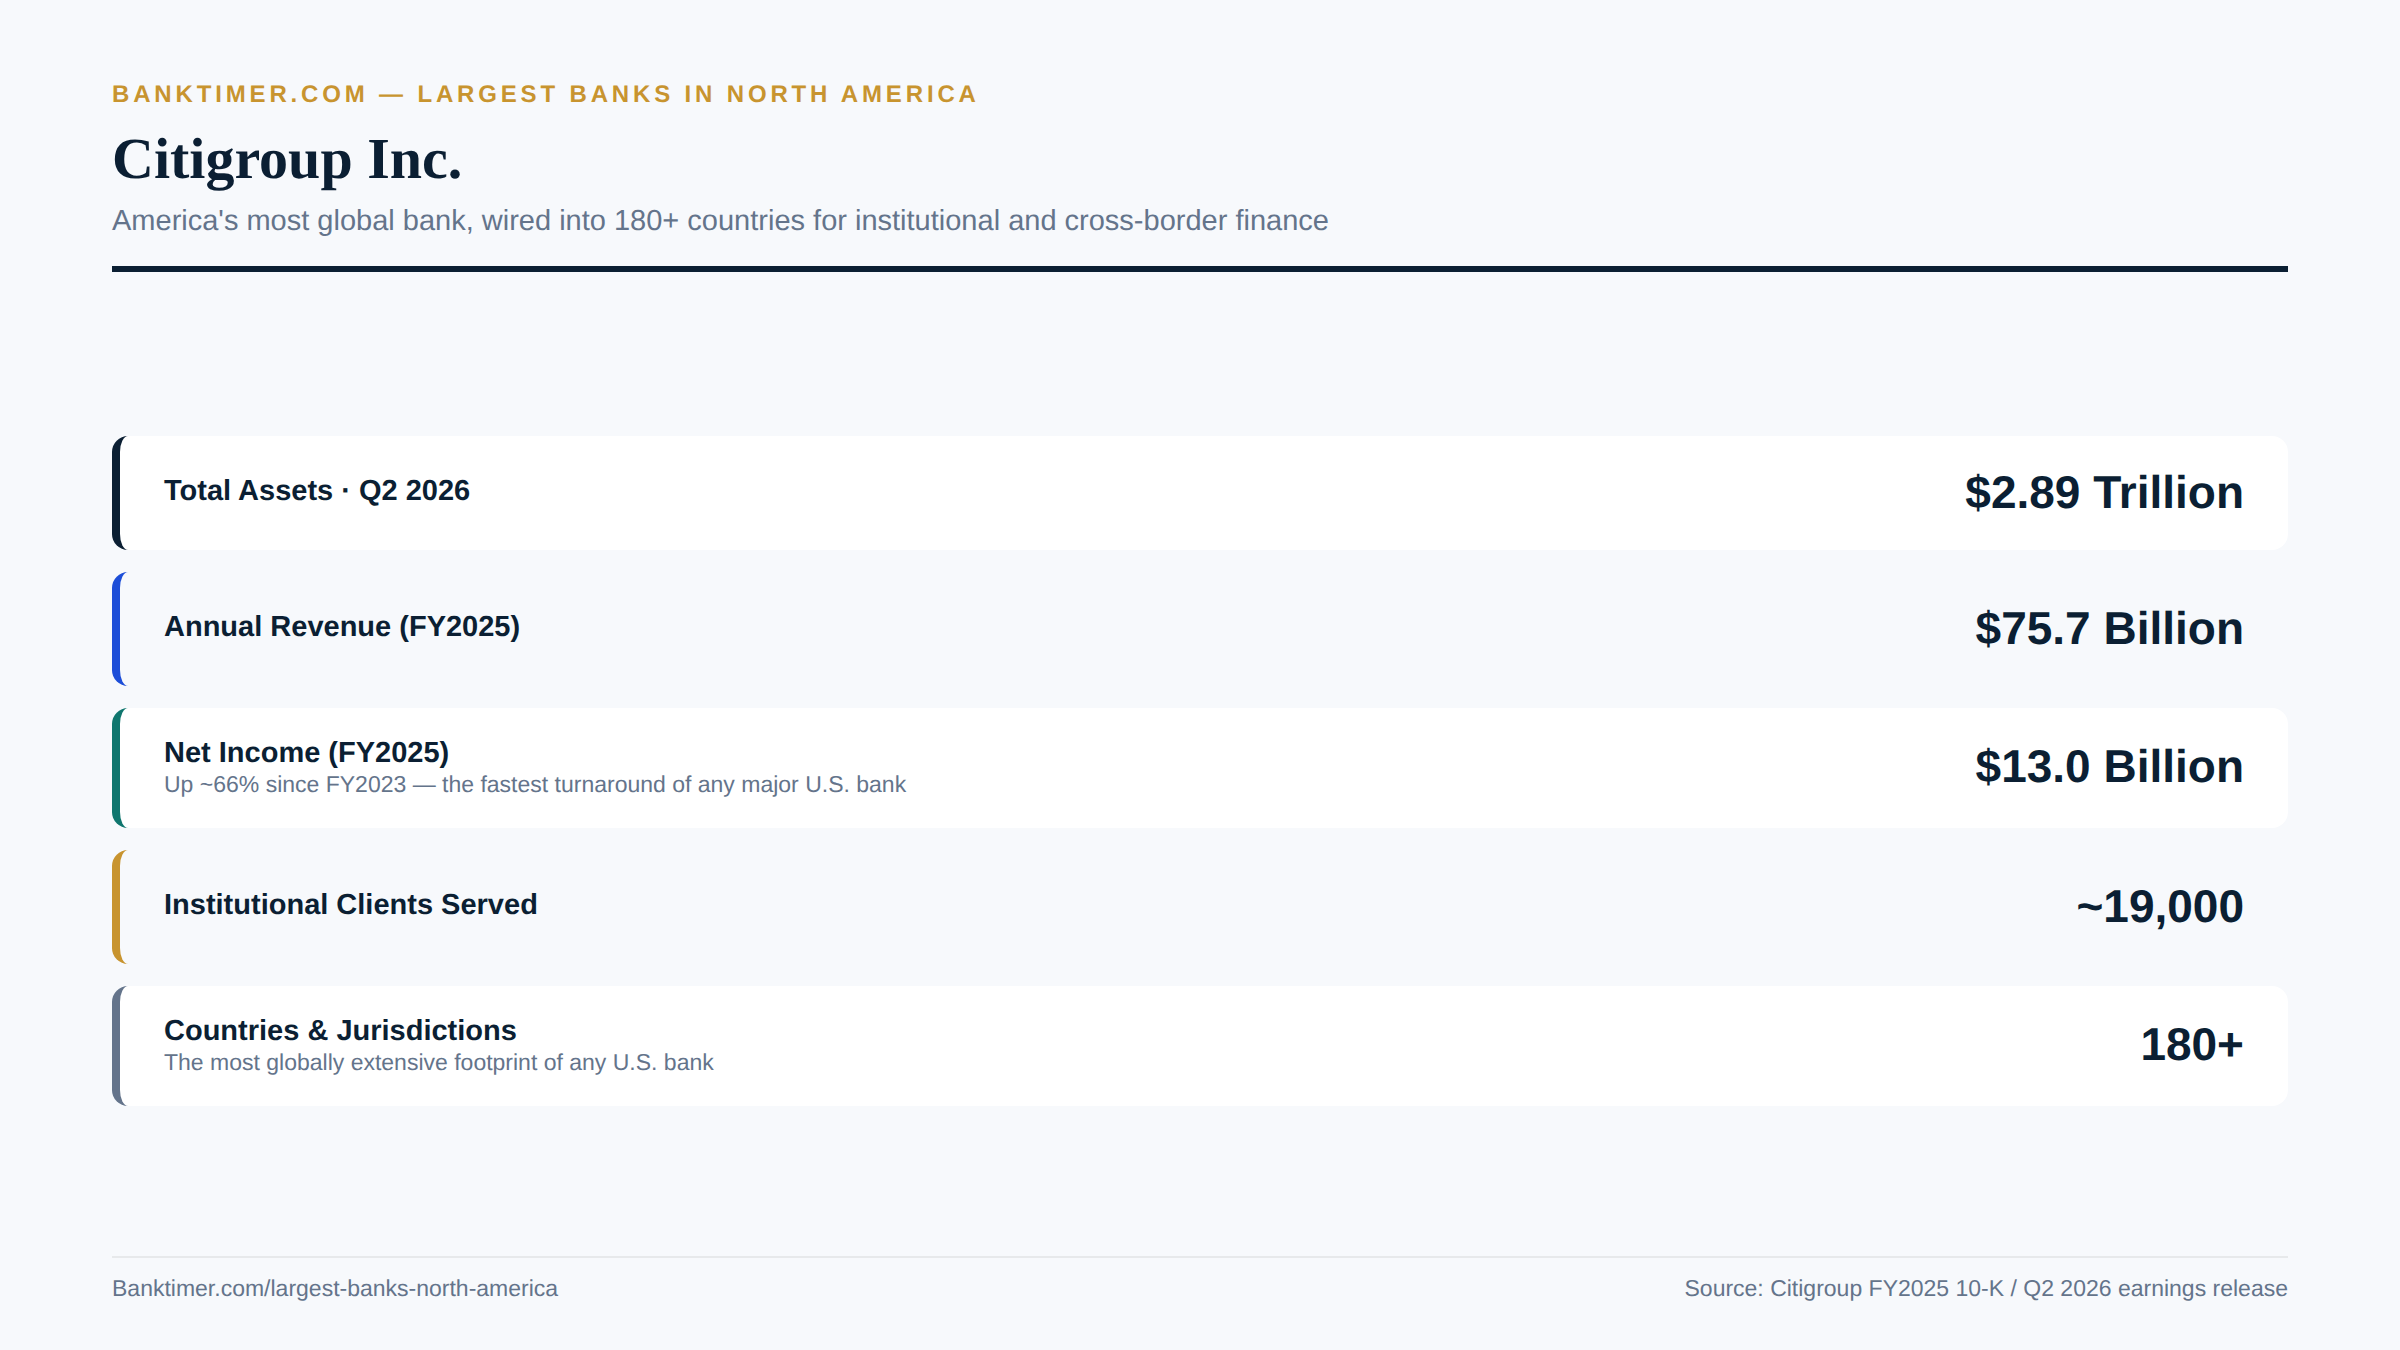
Smallest of the Big Four by assets, biggest by reach: Citi spans 180+ countries
Wells Fargo
Wells Fargo traces its roots to 1852, when Henry Wells and William Fargo launched an express and banking service for prospectors during the California Gold Rush. The company operating under that name today is technically the product of a 1998 merger, when Minneapolis-based Norwest Corporation acquired Wells Fargo & Company and kept its more famous name. Headquartered in San Francisco, with a growing footprint at 30 Hudson Yards in New York, Wells Fargo trades on the NYSE as WFC and carries the federal designation of a Global Systemically Important Bank.
By the numbers, it’s enormous. Average total assets reached $2.2 trillion in the second quarter of 2026, up 15% year over year — a jump tied to one of the more consequential regulatory turnarounds in modern banking. On a domestic-assets basis, independent rankings still placed Wells Fargo third among U.S. lenders as of late 2025, behind only JPMorgan Chase and Bank of America.
Wells Fargo earns its place on this list twice over. It’s one of the largest, oldest banks in North America, and it just closed one of banking’s more dramatic redemption arcs. After seven years under a Fed-imposed asset cap and roughly fifteen years under one consent order or another, Wells Fargo entered 2026 with a clean regulatory slate for the first time in a generation. That turnaround puts Wells Fargo back on stable footing among the largest banks in North America.
Corporate Profile & History
Founding, Headquarters, and Corporate Structure
The Wells Fargo name predates the Civil War, but the modern corporate entity is younger than it looks. Henry Wells and William Fargo founded the original company in 1852 to move mail, gold, and money across the American West. The current holding company came together through the 1998 merger with Norwest Corporation, which kept the Wells Fargo brand despite being the technical acquirer.
Today the bank is headquartered in San Francisco, California, and its principal banking subsidiary, Wells Fargo Bank, N.A., operates under a bank holding company structure. Regulators classify the parent as a Global Systemically Important Bank given its size and its ties to the broader financial system.
Major Mergers, Acquisitions, and Milestones
Wells Fargo has grown largely through acquisition. The 1998 Norwest merger created the modern company, and a decade later, amid the financial crisis, Wells Fargo bought Wachovia Corporation for roughly $14.8 billion, nearly doubling its footprint across the East Coast and Southeast.
More recent moves have gone the other direction. The bank wound down Wells Fargo Rail, once North America’s largest railcar lessor, ceasing operations on January 1, 2026, and it sold its asset-management arm for $2.1 billion back in 2021. Both moves reflect a years-long push to shed non-core businesses — one that accelerated, not coincidentally, after the 2016 fake-accounts scandal reshaped the bank’s priorities.
Leadership and Governance
Charlie Scharf has served as chief executive since October 2019, arriving with a mandate to fix the bank’s regulatory problems. In July 2025, the board announced its intention to add the chairman title to his role as well, a move paired with a retention package reportedly worth $30 million in restricted share rights plus over a million stock options, vesting across several years.
The structure looks built to keep Scharf in place for roughly six more years. When he took over in 2019, Wells Fargo carried 14 outstanding regulatory consent orders. Every one of them had been resolved by March 2026.
Business Segments and Divisions
Wells Fargo organizes around four primary segments: Consumer Banking and Lending, Commercial Banking, Corporate and Investment Banking, and Wealth and Investment Management. That range spans everything from a neighborhood checking account to multibillion-dollar corporate underwriting.
The bank has trimmed several historical side businesses over the past decade, including most of its asset-management operations, as management narrowed its focus toward core banking and wealth management.
Financial Performance & Scale
Total Assets and Balance Sheet Size
Wells Fargo’s balance sheet has taken off since regulators freed it to grow. Average total assets hit $2.2 trillion in Q2 2026, up from $1.9 trillion a year earlier. Full-year 2025 average assets came in at $1.986 trillion, itself up 3.4% from 2024.
Bankrate’s independent September 2025 tally of domestic assets ranked Wells Fargo third among U.S. banks at $1.76 trillion, trailing JPMorgan Chase and Bank of America. The acceleration traces directly to the Federal Reserve’s June 2025 removal of the $1.95 trillion asset cap it had imposed back in February 2018.
Annual Revenue and Net Income
Profitability has climbed alongside the balance sheet. Full-year 2025 revenue reached $83.699 billion, up 1.7% from 2024, while net income rose a sharper 8.2% to $21.338 billion; diluted earnings per share climbed 16.6% to $6.26.
Momentum carried into 2026: second-quarter revenue hit $22.6 billion, up 9% year over year, with net income up 17% to $6.4 billion. Efficiency improved too — the efficiency ratio dropped to 60% from 64%, return on equity rose to 15.0%, and return on tangible common equity reached 17.7%. Average loans grew to $1.03 trillion and deposits to $1.47 trillion, both up double digits.
Customer Count and Market Share
Wells Fargo no longer publishes one tidy market-share figure, a legacy of pulling back from mortgage lending after 2016. Its digital footprint tells the scale story instead: 33 million mobile active users as of early 2026, and an app rating of 4.9 stars built on more than 10 million reviews.
Its AI assistant, Fargo, crossed 1 billion cumulative interactions within three years of its 2023 launch, including 160 million from Spanish-speaking customers alone. Combined with its #3 domestic-assets ranking, that makes Wells Fargo one of the most heavily used retail banks in the country.
Stock Performance and Credit Ratings
Wells Fargo shares closed at $87.05 on September 16, 2026, giving the company a market capitalization of $263.24 billion. The stock ranged between $72.78 and $97.76 over the prior 52 weeks, trades near a 12.65 price-to-earnings ratio, and yields roughly 2.30%. Analysts, on average, rate it a “Buy.”
Credit ratings still show some scar tissue: Moody’s rates the holding company A1 and Fitch rates it A+, while S&P holds it at BBB+, reflecting a downgrade from 2020 that hasn’t been reversed.
Products, Services & Specialties
Core Banking Products
Wells Fargo runs a full retail menu — checking, savings, credit cards, auto loans, personal loans, and mortgages — alongside small-business banking. Readers comparing options might find the fundamentals in banking basics useful groundwork, since the same core mechanics apply whether the bank behind them is a giant or a local credit union.
On the institutional side, the bank layers in commercial and corporate banking, a wealth arm branded Wells Fargo Advisors, and a corporate-and-investment-banking unit that handles underwriting and trading for large clients. Anyone shopping specifically for plastic could start with credit card basics before comparing what Wells Fargo and its competitors actually charge.
Specialty Divisions and Niche Strengths
The standout specialty here is Wells Fargo Advisors, the brokerage and wealth-management arm that ranked #1 among full-service wealth platforms in the 2026 J.D. Power Digital Experience Study — a meaningful edge in a business where digital tools increasingly decide which firm keeps a client’s assets.
The bank used to hold a more unusual niche, too: Wells Fargo Rail, once North America’s largest railcar and locomotive lessor. Management wound that business down as of January 2026, part of the broader shift toward core banking.
Digital Banking and Technology
The digital numbers are hard to ignore: a 4.9-star app rating across more than 10 million reviews, 33 million mobile active users, and an AI assistant that has fielded over a billion customer interactions since 2023. Michelle Moore, the bank’s head of Digital, Data and AI, points to that assistant, Fargo, as central to routine customer service now.
Wells Fargo has also talked publicly about scaling artificial intelligence across service operations in 2026 to manage rising customer demand — a strategy that lines up with the workforce reductions covered later in this profile.
Fees, Rates, and Customer Experience
On pure satisfaction rankings, the strongest data point sits in wealth management, where Wells Fargo Advisors took the #1 spot in J.D. Power’s 2026 Digital Experience Study. Everyday retail banking looks murkier: J.D. Power’s broader 2026 U.S. Retail Banking Satisfaction Study didn’t give any Big Four bank a top regional finish, though it noted national banks’ problem-resolution scores jumped 49 points to 587 year over year.
In short, brokerage clients are getting a genuinely top-rated digital experience, while everyday retail banking sits in the same competitive middle ground as other money-center peers.
Reputation, Risks & Recent Developments
Regulatory History and Compliance Record
No section matters more than this one. In 2016, employees opened more than 1.5 million unauthorized checking and savings accounts and roughly 500,000 unauthorized credit cards, triggering $185 million in initial fines. The fallout kept compounding: a $3 billion DOJ and SEC settlement in 2020, and a record $3.7 billion CFPB settlement in 2022 covering auto loans, mortgages, and deposit accounts.
The Fed had already added its own penalty in 2018 — an asset cap of $1.95 trillion, freezing the balance sheet at 2017 levels. On June 3, 2025, the Fed lifted that cap, and on March 5, 2026, it terminated Wells Fargo’s final outstanding consent order, leaving the bank free of formal consent orders for the first time in roughly fifteen years.
Some litigation lingers: a 2023 shareholder settlement cost $1 billion, and an $85 million hiring-practices settlement was still moving toward court approval in 2026. Neither compares to the scandal-era penalties, but legal cleanup tends to outlast regulatory cleanup.
Competitive Position and Differentiation
Wells Fargo belongs to the informal “Big Four” of U.S. money-center banks, alongside JPMorgan Chase, Bank of America, and Citigroup. For seven years, though, it was the only one of the four operating under a Fed-imposed growth cap — a constraint now gone, which sets up unusual pent-up growth potential relative to peers who were never capped.
By domestic assets, Wells Fargo ranks third nationally, per Bankrate’s September 2025 count. Its newly top-ranked wealth and brokerage franchise gives it an edge that neither U.S. Bancorp nor PNC can currently match at comparable scale.
Recent News and 2026 Developments
The headline story of 2026 is regulatory freedom. The Fed’s March 5 termination of the last consent order capped a remediation effort that started with 14 outstanding orders back in 2019. Weeks later, the bank touted a cluster of digital milestones, including its billionth Fargo AI interaction.
Not every 2026 headline has been about growth, though. Wells Fargo Rail ceased operations in January, and layoff tracking shows continued cost-cutting, with more than 13,000 cumulative job cuts tracked since 2003, including another round in July 2026. Second-quarter earnings still beat estimates on strength in wealth management and investment banking.
Strengths, Weaknesses, and Who This Bank Suits
The strengths are substantial: an unrestricted balance sheet for the first time since 2018, a #1-ranked wealth-management digital platform, and profitability metrics — like a 17.7% return on tangible common equity — moving firmly in the right direction.
The weaknesses trace to the same history that makes the turnaround notable. Fourteen consent orders since 2019, fines well north of several billion dollars across just the DOJ, SEC, and CFPB settlements, and continued layoffs suggest a bank still finishing a long cleanup even as its regulatory status improves.
This bank suits large consumer and institutional customers who want full-service, money-center scale from an institution finally free of its regulatory overhang, plus wealth clients drawn to Wells Fargo Advisors’ newly top-rated platform. It’s a tougher fit for anyone still wary of the bank’s scandal history or who prefers a smaller, community-oriented institution. A clean regulatory record now puts Wells Fargo back in good standing among the largest banks in North America.
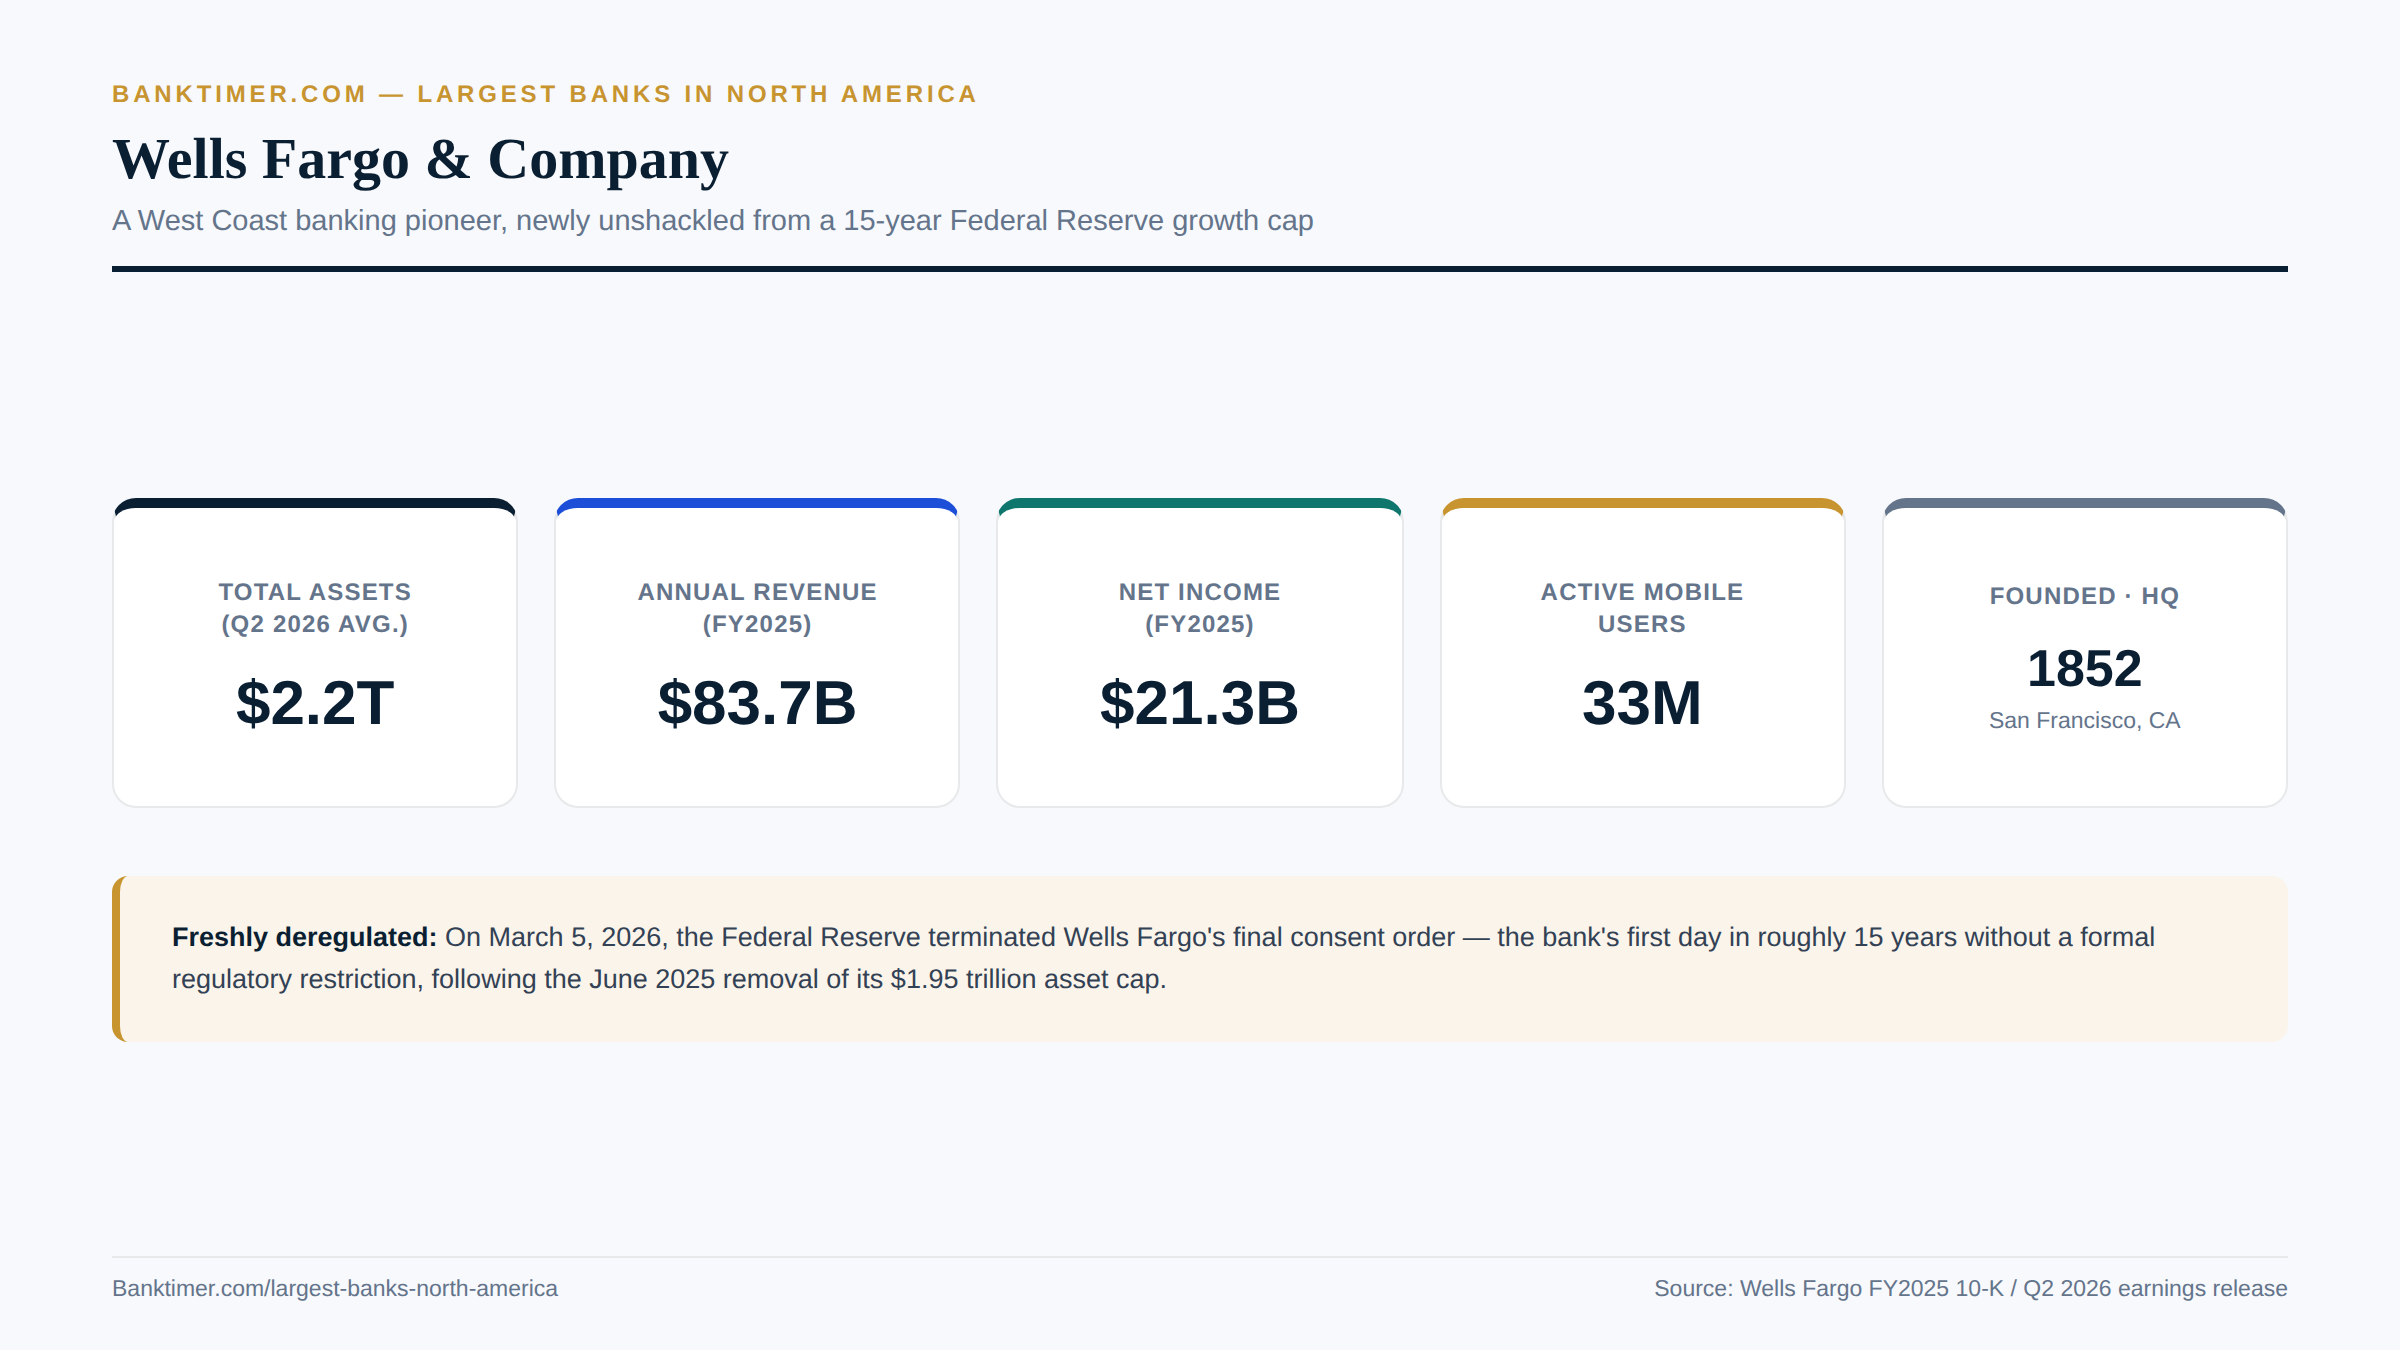
Free of its 15-year Fed cap, Wells Fargo is finally off the leash
U.S. Bancorp
U.S. Bancorp, better known to customers as U.S. Bank, traces its charter lineage to 1863, back to the original First National Bank of Cincinnati. The modern company took its current shape in 1997, when First Bank System acquired U.S. Bancorp of Oregon and adopted its name, settling into headquarters at U.S. Bancorp Center in Minneapolis, Minnesota. It trades on the NYSE as USB and sits in both the S&P 100 and S&P 500.
U.S. Bancorp doesn’t chase the scale of the money-center giants, and it doesn’t need to. Total assets stood at $692 billion as of December 31, 2025, enough to make it the largest U.S. bank that isn’t classified as a Global Systemically Important Bank — a status often shorthanded as America’s biggest “super-regional.”
It belongs on this list because of what that super-regional scale actually delivers: record quarterly revenue, a payments-processing arm with genuine global reach, and a 2026 acquisition that pushes the bank further into capital markets than its Midwest-regional peers have gone. Those numbers keep U.S. Bancorp solidly positioned among the largest banks in North America, even without the mega-bank label.
Corporate Profile & History
Founding, Headquarters, and Corporate Structure
U.S. Bancorp’s charter dates to 1863, tracing back to the original First National Bank of Cincinnati. Its modern form emerged in 1997, when Minneapolis-based First Bank System acquired U.S. Bancorp of Oregon for roughly $9 billion and adopted the U.S. Bancorp name for the combined company.
The bank is headquartered at U.S. Bancorp Center on Nicollet Mall in Minneapolis. It trades on the NYSE under the ticker USB, sits in both the S&P 100 and S&P 500, and operates as a super-regional bank rather than a Global Systemically Important one — its principal subsidiary is U.S. Bank National Association.
Major Mergers, Acquisitions, and Milestones
The 1997 First Bank System deal set the template U.S. Bancorp has followed since: grow through acquisition, then absorb the target’s brand into its own. In 2001, the company effectively merged with Firstar Corporation in a roughly $21 billion deal — technically Firstar was the acquirer, but the combined company kept the U.S. Bancorp name and Minneapolis headquarters.
More recently, U.S. Bancorp bought MUFG Union Bank’s core consumer business for about $8 billion in 2022, substantially expanding its West Coast branch network. Then, on June 1, 2026, it closed its acquisition of BTIG, an institutional brokerage and capital-markets firm, for $395 million in cash plus 6.6 million shares, with up to $275 million more in potential earn-out payments.
Leadership and Governance
Gunjan Kedia became chief executive in mid-April 2025, succeeding Andy Cecere, who moved into the role of Executive Chairman. Roughly a year later, following the bank’s April 2026 annual shareholder meeting, Kedia also took on the title of Board Chairman — meaning she now holds both roles, a consolidation that echoes what Wells Fargo’s board separately proposed for its own CEO around the same period.
Cecere retired from the board at that same April 2026 meeting after more than 40 years in financial services. Roland Hernandez continues as lead independent director, and Kedia herself was named to Fortune’s 2026 Most Powerful Women ranking — recognition that lands as she steers the bank through its largest strategic pivot in years, the move into capital markets via BTIG.
Business Segments and Divisions
U.S. Bancorp organizes its business into three reporting segments: Consumer and Business Banking, which generated 31% of 2025 revenue; Payment Services, at 26%; and Wealth, Corporate, Commercial and Institutional Banking, the largest at 43%.
Key subsidiaries flesh out that structure, including Elavon, a global merchant-payment processor; Talech, a point-of-sale software platform; Syncada, a supply-chain and trade-finance system; and, as of mid-2026, BTIG’s institutional brokerage operation.
Financial Performance & Scale
Total Assets and Balance Sheet Size
U.S. Bancorp reported $692 billion in total assets as of December 31, 2025, per its own investor materials. Bankrate’s independent September 2025 count put domestic assets slightly lower, at $671.2 billion, ranking the bank fifth nationally.
Either way, the trajectory points up. Total assets climbed from roughly $680 billion in mid-2024 toward the $690–700 billion range through 2025 and 2026, helped along by the BTIG acquisition and a record second quarter in 2026.
Annual Revenue and Net Income
Full-year 2025 revenue came to $28.7 billion, with net income of $7.57 billion and total equity of $65.2 billion; the bank’s Tier 1 capital ratio stood at 10.9%.
The second quarter of 2026 set a new bar: net revenue of $7.712 billion, up 10.1% and a company record, with net income up 20% to $2.177 billion and diluted earnings per share up roughly 22% to $1.35.
Efficiency metrics backed up the growth story. Return on average assets hit 1.26%, the efficiency ratio improved to 57.1%, return on tangible common equity reached 18.7%, and the bank generated 400 basis points of positive operating leverage year over year. Total loans grew to $410.3 billion and deposits to $532.1 billion, while nonperforming assets fell 15.3%. Management raised its full-year 2026 outlook after the results came in.
Customer Count and Market Share
U.S. Bancorp ranks fifth among U.S. banks by domestic assets, per Bankrate’s tally, employing roughly 70,000 people across a branch network spanning 26 states, with additional operations in 13 countries tied largely to Elavon’s global payments business.
Digital adoption runs high: more than 80% of consumer transactions and 65% of loan sales now happen digitally, and the bank’s mobile app has delivered some 2 billion personalized insights to customers over time. U.S. Bancorp ranks #110 on the Fortune 500.
Stock Performance and Credit Ratings
U.S. Bancorp shares closed at $59.73 on September 16, 2026, valuing the company at $93.06 billion. Shares have traded between $45.02 and $66.08 over the past year, sit near a 11.92 price-to-earnings ratio, and yield about 3.62%. Analysts rate the stock a “Buy” on average.
Credit ratings, as of a June 2026 summary, show the holding company rated A3 by Moody’s, A by S&P, and A+ by Fitch, all with stable outlooks — comfortably investment-grade, and a notch or two above some larger, more scandal-scarred peers.
Products, Services & Specialties
Core Banking Products
U.S. Bank offers the full consumer suite — checking, savings, credit cards, mortgages, and auto loans — plus small-business banking. The real story sits in what it doesn’t lead with, though: consumer banking makes up barely a third of total revenue here.
Instead, U.S. Bancorp leans hardest on its Wealth, Corporate, Commercial and Institutional Banking segment, which generated 43% of 2025 revenue, the largest share of any segment — a reminder that this bank depends more on institutional and commercial relationships than its consumer-facing branch network might suggest.
Specialty Divisions and Niche Strengths
Elavon, the bank’s global merchant-payment processor, is the standout specialty here, anchoring a Payment Services segment that generates 26% of total revenue — an unusually large share for a bank of this size, and one that gives U.S. Bancorp genuine international reach.
The 2026 BTIG acquisition adds another layer: institutional brokerage and equities capabilities that push U.S. Bancorp into capital-markets territory most regional banks don’t touch. Larger commercial clients evaluating financing options may find it worth understanding the credit underwriting process that shapes how a bank this size actually approves institutional lending.
Digital Banking and Technology
More than 80% of consumer transactions and 65% of loan sales at U.S. Bank now happen digitally, and the mobile app has delivered roughly 2 billion personalized insights to customers cumulatively.
In May 2026, the bank expanded its partnership with Amazon Web Services to accelerate its technology transformation and AI-driven customer-experience work. Trade-press coverage from earlier in the year cited an estimated $2.6 billion in cumulative technology investment, though that figure is worth confirming against the bank’s own investor materials before treating it as precise.
Fees, Rates, and Customer Experience
U.S. Bank didn’t land a regional #1 finish in J.D. Power’s 2026 U.S. Retail Banking Satisfaction Study; the fifteen regional top spots went instead to smaller, more focused players like Frost, Huntington, and Capital One. That’s not unusual for a bank this size — scale and top-of-market satisfaction scores don’t always move together — but it does mean U.S. Bank competes more on breadth and payments capability than on a headline satisfaction ranking.
For everyday customers, the practical experience still leans on that same breadth. A checking account opened at a U.S. Bank branch in Minneapolis works identically to one opened at a former MUFG Union Bank branch in Los Angeles, and the same digital tools — mobile deposit, bill pay, budgeting dashboards — sit behind both. Readers still getting comfortable with how deposit accounts, statements, and everyday fees fit together may find banking basics a useful primer before comparing U.S. Bank’s fee schedule against competitors.
Reputation, Risks & Recent Developments
Regulatory History and Compliance Record
U.S. Bancorp’s biggest regulatory black mark dates to 2018, when the Department of Justice found the bank had failed to implement adequate anti-money-laundering controls, particularly regarding its dealings with payday lender Scott Tucker. The bank agreed to pay $613 million combined across DOJ, Federal Reserve, OCC, FinCEN, and a Manhattan district attorney action.
Since then, the record looks comparatively quiet. A review of the CFPB’s public enforcement listing didn’t turn up a major action against U.S. Bank in the years since, though that’s worth independent reconfirmation given how enforcement databases get updated. Compared with Wells Fargo’s parade of scandal-era settlements, U.S. Bancorp’s compliance history reads as the cleanest of the three banks profiled here.
Competitive Position and Differentiation
U.S. Bancorp holds the title of largest U.S. super-regional bank — the biggest lender that isn’t one of the four G-SIB money-center banks — ranking fifth overall by domestic assets. Its Elavon payments business gives it an outsized international footprint most regional peers can’t match, with operations spanning 13 countries.
The 2026 BTIG deal adds another differentiator: a genuine capital-markets push that positions U.S. Bancorp to compete more directly with larger investment banks in institutional brokerage, a lane neither Wells Fargo’s wealth arm nor PNC’s advisory business occupies in quite the same way.
Recent News and 2026 Developments
Leadership transitioned twice in fairly short order: Kedia became CEO in April 2025, then added the chairman title in April 2026 as Cecere retired from the board after four decades in the industry. The BTIG acquisition closed June 1, 2026, and the AWS partnership expansion followed in May.
The second quarter capped the run of good news, with record net revenue of $7.712 billion and a raised full-year outlook — a sign that the strategic bets on payments and capital markets are showing up in the numbers, not just the press releases.
Strengths, Weaknesses, and Who This Bank Suits
The strengths line up cleanly: record revenue, an improving 57.1% efficiency ratio, an 18.7% return on tangible common equity, and a payments franchise that diversifies fee income in a way most regional peers can’t replicate. Its regulatory record, aside from the 2018 AML settlement, looks notably clean next to Wells Fargo’s.
The weaknesses come down to scale and reach. Ranking fifth by assets limits how aggressively U.S. Bancorp can compete with G-SIBs on the largest balance-sheet-intensive deals, and its 26-state branch network, concentrated in the Midwest and West, is smaller than Wells Fargo’s or even PNC’s post-acquisition national footprint.
This bank suits mid-size and larger businesses that want integrated payments processing bundled with banking, wealth and institutional clients in its core Midwest and Western markets, and investors drawn to a super-regional with a currently clean regulatory slate. It’s a weaker fit for anyone who specifically needs coast-to-coast branch access. That combination of scale and specialty payments revenue keeps U.S. Bancorp comfortably inside the largest banks in North America.
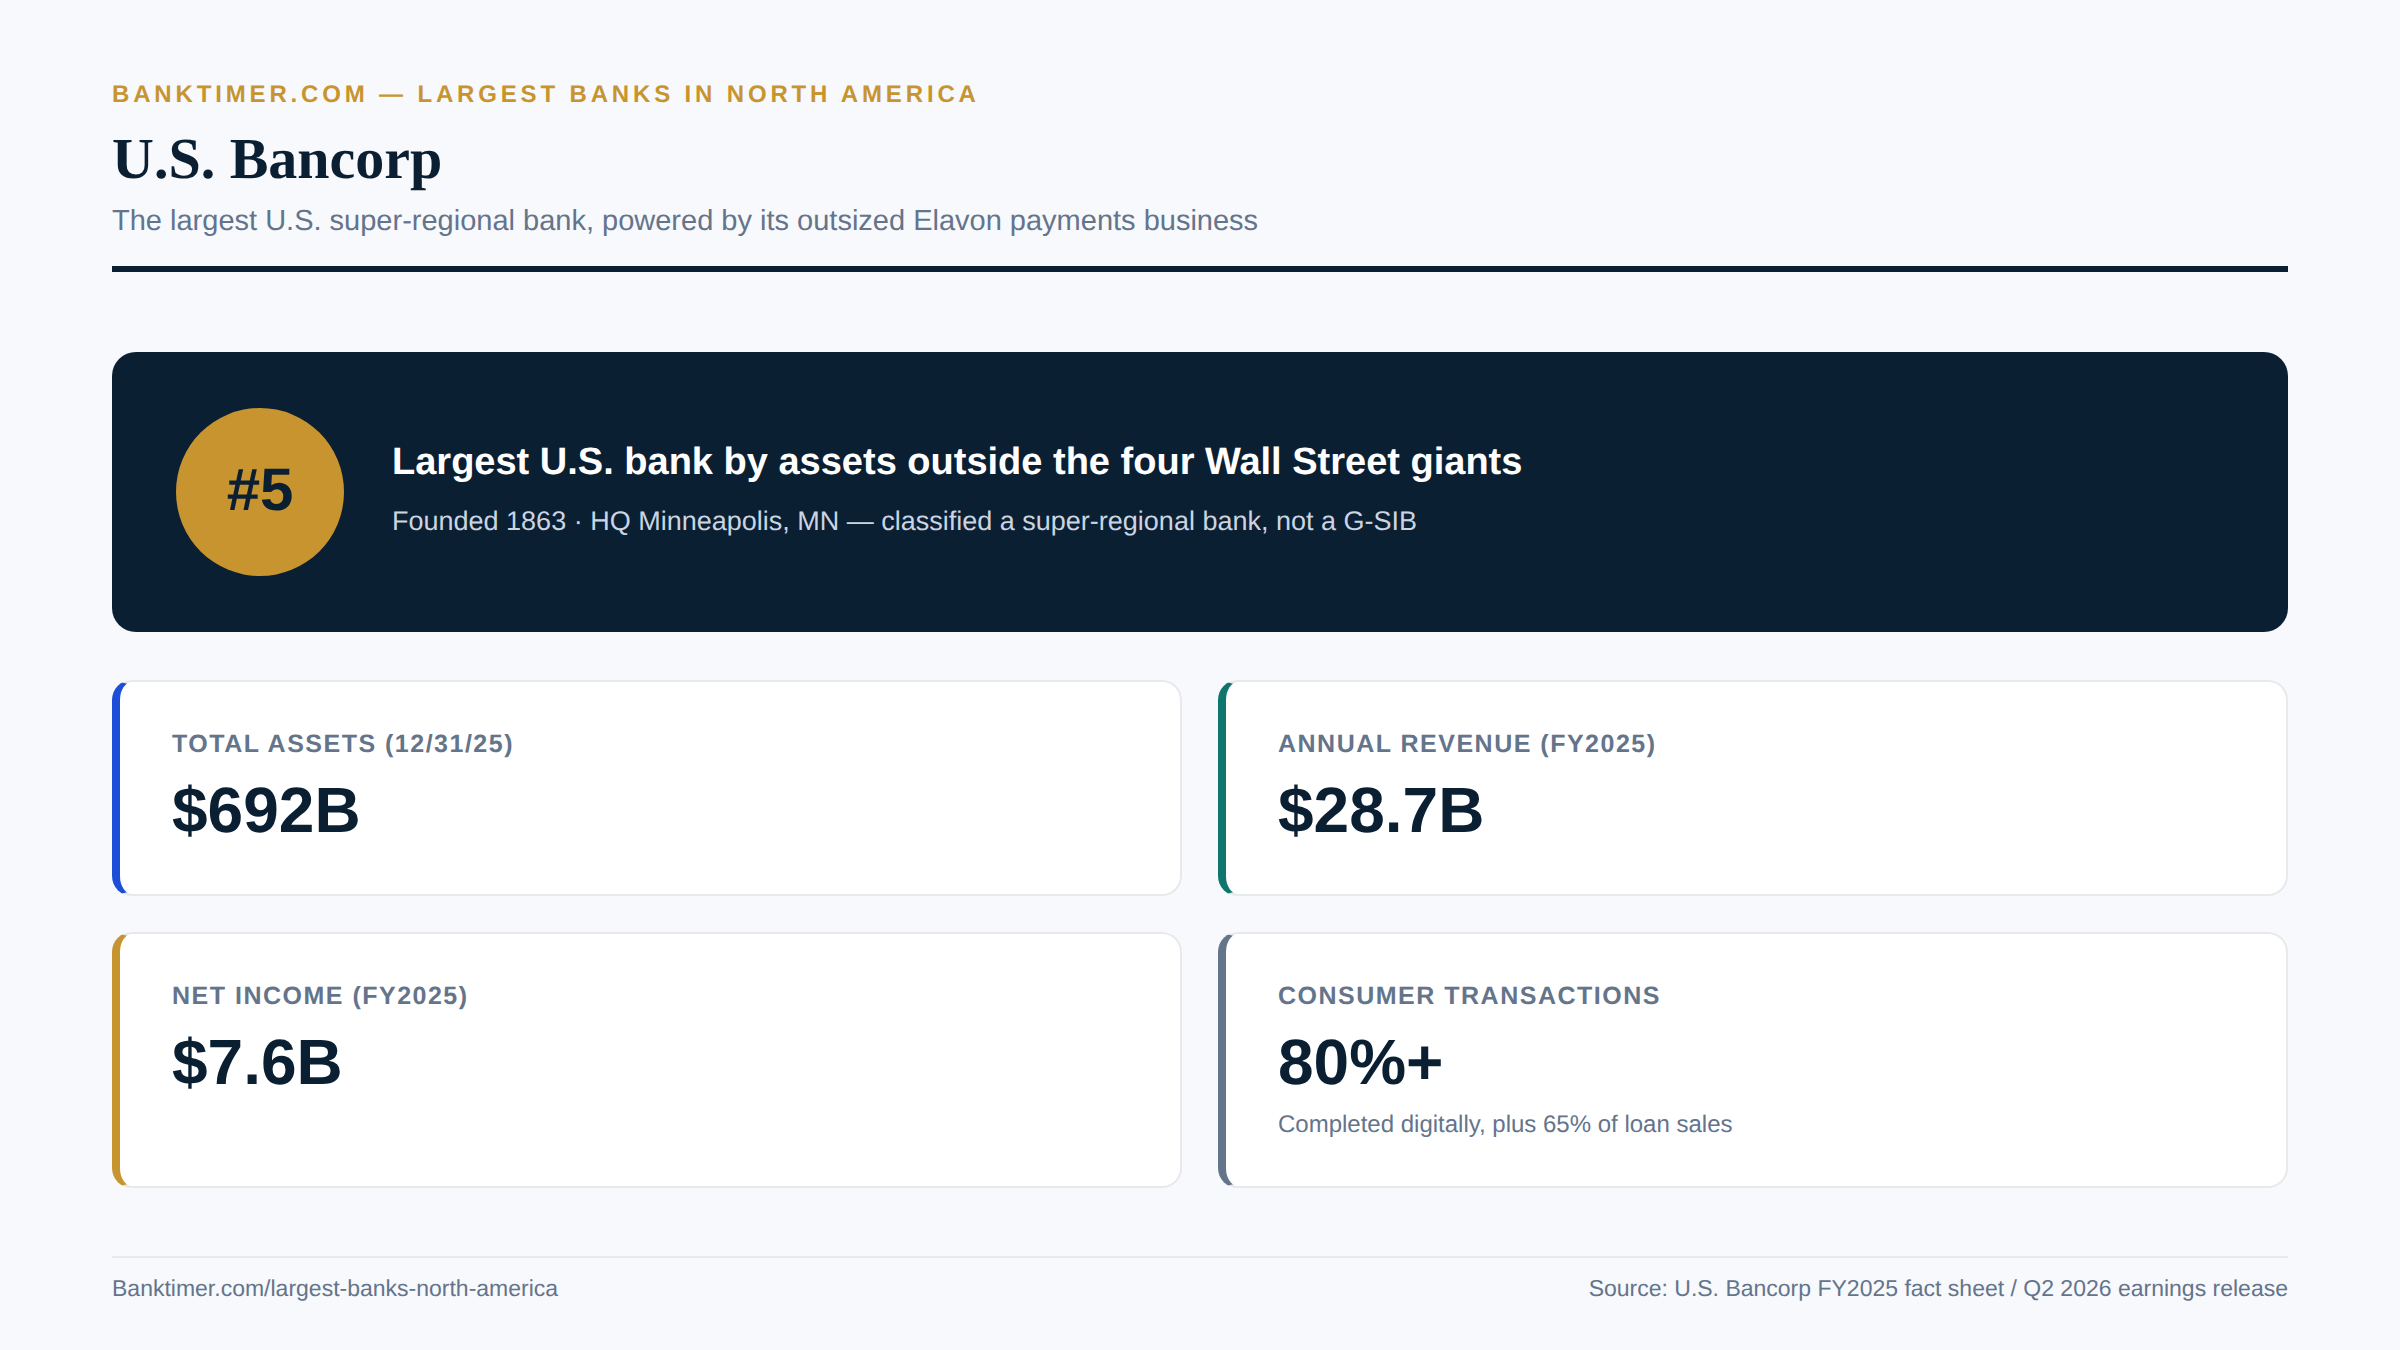
#5 and rising: the biggest bank that isn’t a Wall Street giant
PNC Financial Services Group
PNC Financial Services Group traces its roots to the Pittsburgh Trust and Savings Company, founded in 1845. The modern corporation took shape in 1982, when Pittsburgh National Corporation merged with Provident National Corporation — hence the initials “PNC.” Headquartered at the Tower at PNC Plaza in Pittsburgh, Pennsylvania, the bank trades on the NYSE as PNC and sits in the S&P 500.
PNC has built its scale less through organic growth than through a string of well-timed acquisitions. Total assets reached $616.034 billion as of June 30, 2026, a figure boosted in part by its most recent deal, and enough to place it firmly among the ten or so largest banks in the country.
It belongs on this list as the clearest example of the “build through acquisition” playbook among super-regional banks — National City in 2008, RBC Bank USA in 2012, BBVA USA in 2021, and FirstBank Holding in 2026 — a three-decade pattern that has turned a Pittsburgh, Mid-Atlantic bank into a genuinely national franchise. That steady expansion has made PNC one of the more consistently growing names among the largest banks in North America.
Corporate Profile & History
Founding, Headquarters, and Corporate Structure
PNC’s history stretches back to the Pittsburgh Trust and Savings Company, founded on April 10, 1845, and fully operational by 1852. The modern PNC Financial Corporation formed in 1982 through the merger of Pittsburgh National Corporation and Provident National Corporation, a combination that gave the bank both its name and its initials.
PNC is headquartered at the Tower at PNC Plaza on Fifth Avenue in Pittsburgh, a building that opened in October 2015. It trades on the NYSE under the ticker PNC, belongs to the S&P 500, and operates as a super-regional bank through its principal subsidiary, PNC Bank, National Association.
Major Mergers, Acquisitions, and Milestones
PNC’s history since 1982 is really a history of acquisitions. During the 2008 financial crisis, it bought National City Corporation for $5.2 billion, a transformative deal that considerably expanded its Midwest presence. It followed that in 2012 with the $3.45 billion purchase of RBC Bank USA, adding Southeast branches.
The pattern continued in June 2021 with an $11.6 billion acquisition of BBVA USA, one of the largest bank mergers of the past decade, pushing PNC into Texas and the broader Sun Belt. Most recently, PNC closed a $4.1 billion acquisition of FirstBank Holding Co. on January 5, 2026, completing the systems conversion — roughly 780,000 customers, 1,620-plus employees, and 95 branches across Colorado and Arizona — by June 22, 2026.
Leadership and Governance
William S. Demchak has led PNC as chairman, president, and chief executive since becoming CEO on April 23, 2013, adding the chairman title the following year. That gives him more than 12 years at the helm as of 2026, a tenure notable for its stability compared with the leadership churn seen at Wells Fargo and U.S. Bancorp over the same period.
Before joining PNC, Demchak spent years at JPMorgan Chase as global head of structured finance and credit portfolio, experience that arguably shaped PNC’s comfort with large, complex acquisitions.
Business Segments and Divisions
PNC organizes its business into three primary segments: Retail Banking, Corporate & Institutional Banking, and Asset Management Group. Each contributes meaningfully to results, with Corporate & Institutional Banking typically carrying the largest share of average loans.
Beyond the core segments, PNC owns two well-regarded specialty subsidiaries: Harris Williams & Co., a middle-market M&A advisory firm, and Midland Loan Services, a major commercial mortgage and CMBS servicing platform.
Financial Performance & Scale
Total Assets and Balance Sheet Size
PNC’s total assets stood at $616.034 billion as of June 30, 2026, up from roughly $554.7 billion just a year earlier — growth driven substantially by the FirstBank Holding acquisition. Bankrate’s September 2025 count, taken before that deal closed, ranked PNC seventh nationally by domestic assets at $558.8 billion.
The gap between those two figures, pre- and post-FirstBank, shows how quickly a single acquisition can reshape a super-regional bank’s standing among its peers.
Annual Revenue and Net Income
Second-quarter 2026 revenue reached $6.875 billion, up 12% from the prior quarter and 21% year over year. Net income came to $2.055 billion, with diluted earnings per share of $4.81 ($4.85 on an adjusted basis).
Profitability metrics moved in the right direction too: return on equity hit 13.61%, return on tangible common equity reached 17.88%, and net interest margin came in at 2.96%. Total loans reached $367.953 billion and deposits $449.792 billion. Trailing-twelve-month revenue through mid-September 2026 stood near $24.32 billion, up 14.5%, with net income around $7.26 billion, up nearly 23%.
PNC returned $1.3 billion in capital to shareholders during the quarter, split between dividends and buybacks, and the board raised the quarterly dividend 18% to $2.00 per share.
Customer Count and Market Share
PNC ranked seventh among U.S. banks by domestic assets in Bankrate’s pre-FirstBank count, a position that has since improved with the FirstBank deal adding roughly 780,000 customers across Colorado and Arizona.
Branch counts are a little harder to pin down precisely during a year of active acquisition — estimates range from roughly 2,200 to 2,600-plus branches depending on the count date and source — but PNC customers get free access to a much larger surcharge-free network, with partner arrangements covering an estimated 60,000 ATMs nationwide. The bank’s Asset Management Group alone oversees $503 billion in total client assets.
Stock Performance and Credit Ratings
PNC shares closed at $231.49 on September 16, 2026, valuing the company at $92.35 billion. The stock traded between $176.88 and $258.96 over the prior year, sits near a 12.74 price-to-earnings ratio, and yields roughly 3.46% following the 2026 dividend increase. Analysts rate it a “Buy” on average, with an implied upside near 20%.
Third-party rating compilations, last confirmed around 2023, place PNC’s senior debt near A3 from Moody’s, A- from S&P, and A from Fitch — solidly investment-grade, though readers should treat these as directional rather than a current, PNC-confirmed snapshot.
Products, Services & Specialties
Core Banking Products
PNC’s flagship consumer offering is Virtual Wallet, a bundled three-account system pairing a Spend checking account (with a monthly fee waivable through direct deposit or a minimum balance) with Reserve, a short-term savings account, and Growth, a longer-term savings account. A standalone high-yield savings option pays a more competitive rate but is only available in states where PNC has no branches.
Beyond consumer banking, PNC runs full commercial and corporate lending, treasury management, SBA lending, credit cards, and mortgage products through its Retail and Corporate & Institutional Banking segments — the kind of breadth that shapes eligibility outcomes tied as closely to a borrower’s own credit score as to any single bank’s underwriting quirks.
Specialty Divisions and Niche Strengths
Harris Williams & Co. gives PNC a genuinely well-regarded presence in middle-market M&A advisory, while Midland Loan Services anchors a top commercial mortgage and CMBS servicing platform — both niche businesses that punch above PNC’s overall size.
The bank’s Asset Management Group, with $503 billion in total client assets as of mid-2026, rounds out a specialty lineup built around a multi-decade Sun Belt and Southeast expansion strategy, most recently extended by the FirstBank Holding deal in Colorado and Arizona.
Digital Banking and Technology
PNC’s standout digital feature is Low Cash Mode, an overdraft-protection tool on the Virtual Wallet Spend account that gives customers at least 24 hours to bring their balance back to zero before fees kick in, alongside alerts and control over which transactions post during a negative-balance period.
Virtual Wallet also bundles budgeting tools directly into the app — savings goals, savings rules, a calendar view, and a visual “Money Bar” that tracks spending automatically by category — features aimed at customers who want more visibility than a bare-bones checking account provides.
Fees, Rates, and Customer Experience
PNC’s Virtual Wallet carries a $7 monthly fee that’s waivable, while its standalone savings account charges nothing monthly, aside from a modest $3 fee on transfers beyond six per month. Rates on certificates of deposit, however, run notably low — around 0.02% on one-, three-, and five-year terms in recent reviews.
On customer satisfaction, PNC reportedly placed fifth in an earlier J.D. Power national banking study, though that ranking is worth confirming directly against J.D. Power’s own release. In the 2026 regional satisfaction rankings, PNC — like Wells Fargo and U.S. Bank — didn’t top any of the fifteen regions, which instead went to more narrowly focused regional players.
Reputation, Risks & Recent Developments
Regulatory History and Compliance Record
PNC’s more serious regulatory episodes sit further in the past than Wells Fargo’s. In 2003, it paid a $115 million securities-fraud settlement over improperly moving $762 million in bad loans off its books to conceal them from investors. In December 2013, it paid $35 million to settle claims that National City Bank, the subsidiary PNC acquired in 2008, had charged Black and Hispanic borrowers higher mortgage rates than white borrowers between 2002 and 2008, affecting more than 75,000 borrowers.
Smaller settlements followed in the years after — a municipal-bond disclosure fine in 2015, a wage-and-overtime settlement in 2017, and a funeral-trust-fund judgment in 2021. No major new CFPB, OCC, or Fed enforcement action against PNC surfaced for 2025 or 2026, making its recent record comparatively quiet next to Wells Fargo’s.
Competitive Position and Differentiation
PNC ranked seventh by domestic assets before the FirstBank deal closed, and larger still afterward at roughly $616 billion in total assets. What differentiates it isn’t sheer size but a genuinely three-decade acquisition strategy — National City in 2008, RBC Bank USA in 2012, BBVA USA in 2021, and FirstBank Holding in 2026 — that has methodically turned a Pittsburgh regional bank into a Sun Belt player.
Its specialty M&A-advisory and CMBS-servicing franchises, through Harris Williams and Midland Loan Services, differentiate PNC’s institutional business from both Wells Fargo and U.S. Bancorp, neither of which runs a comparable dedicated advisory arm at similar scale.
Recent News and 2026 Developments
PNC completed the FirstBank Holding acquisition on January 5, 2026, and finished converting FirstBank’s customers, employees, and branches onto its own systems by June 22. Integration wasn’t free — costs ran $127 million in the second quarter alone, trimming that quarter’s earnings by roughly $0.04 per share.
The bank still reported strong second-quarter results in July, raised its quarterly dividend 18%, and returned $1.3 billion to shareholders. In September, PNC launched “PNC Workplace Advantage,” a new employer-sponsored workplace banking program, and adjusted its prime rate to 7.00%, effective September 17, 2026.
Strengths, Weaknesses, and Who This Bank Suits
PNC’s strengths center on execution: a repeated track record of absorbing large acquisitions — National City, BBVA USA, FirstBank — without a major post-deal regulatory blowup, strong recent profitability with a 17.88% return on tangible common equity, and a diversified three-segment model anchored by a $503 billion asset-management book.
The weaknesses trace to that same acquisitive strategy. The FirstBank integration cost $127 million in a single quarter, the legacy National City redlining settlement remains a real historical blemish, and PNC’s savings and CD rates can lag more competitive online-only banks by a wide margin.
This bank suits customers in PNC’s expanding Sun Belt and legacy Mid-Atlantic markets who want sophisticated budgeting tools like Virtual Wallet and Low Cash Mode, middle-market businesses seeking M&A advisory or CMBS servicing, and dividend-focused investors drawn to the 2026 payout increase. It’s a weaker fit for rate-sensitive savers chasing the top APYs available elsewhere. Three decades of disciplined acquisitions have carried PNC firmly into the ranks of the largest banks in North America.
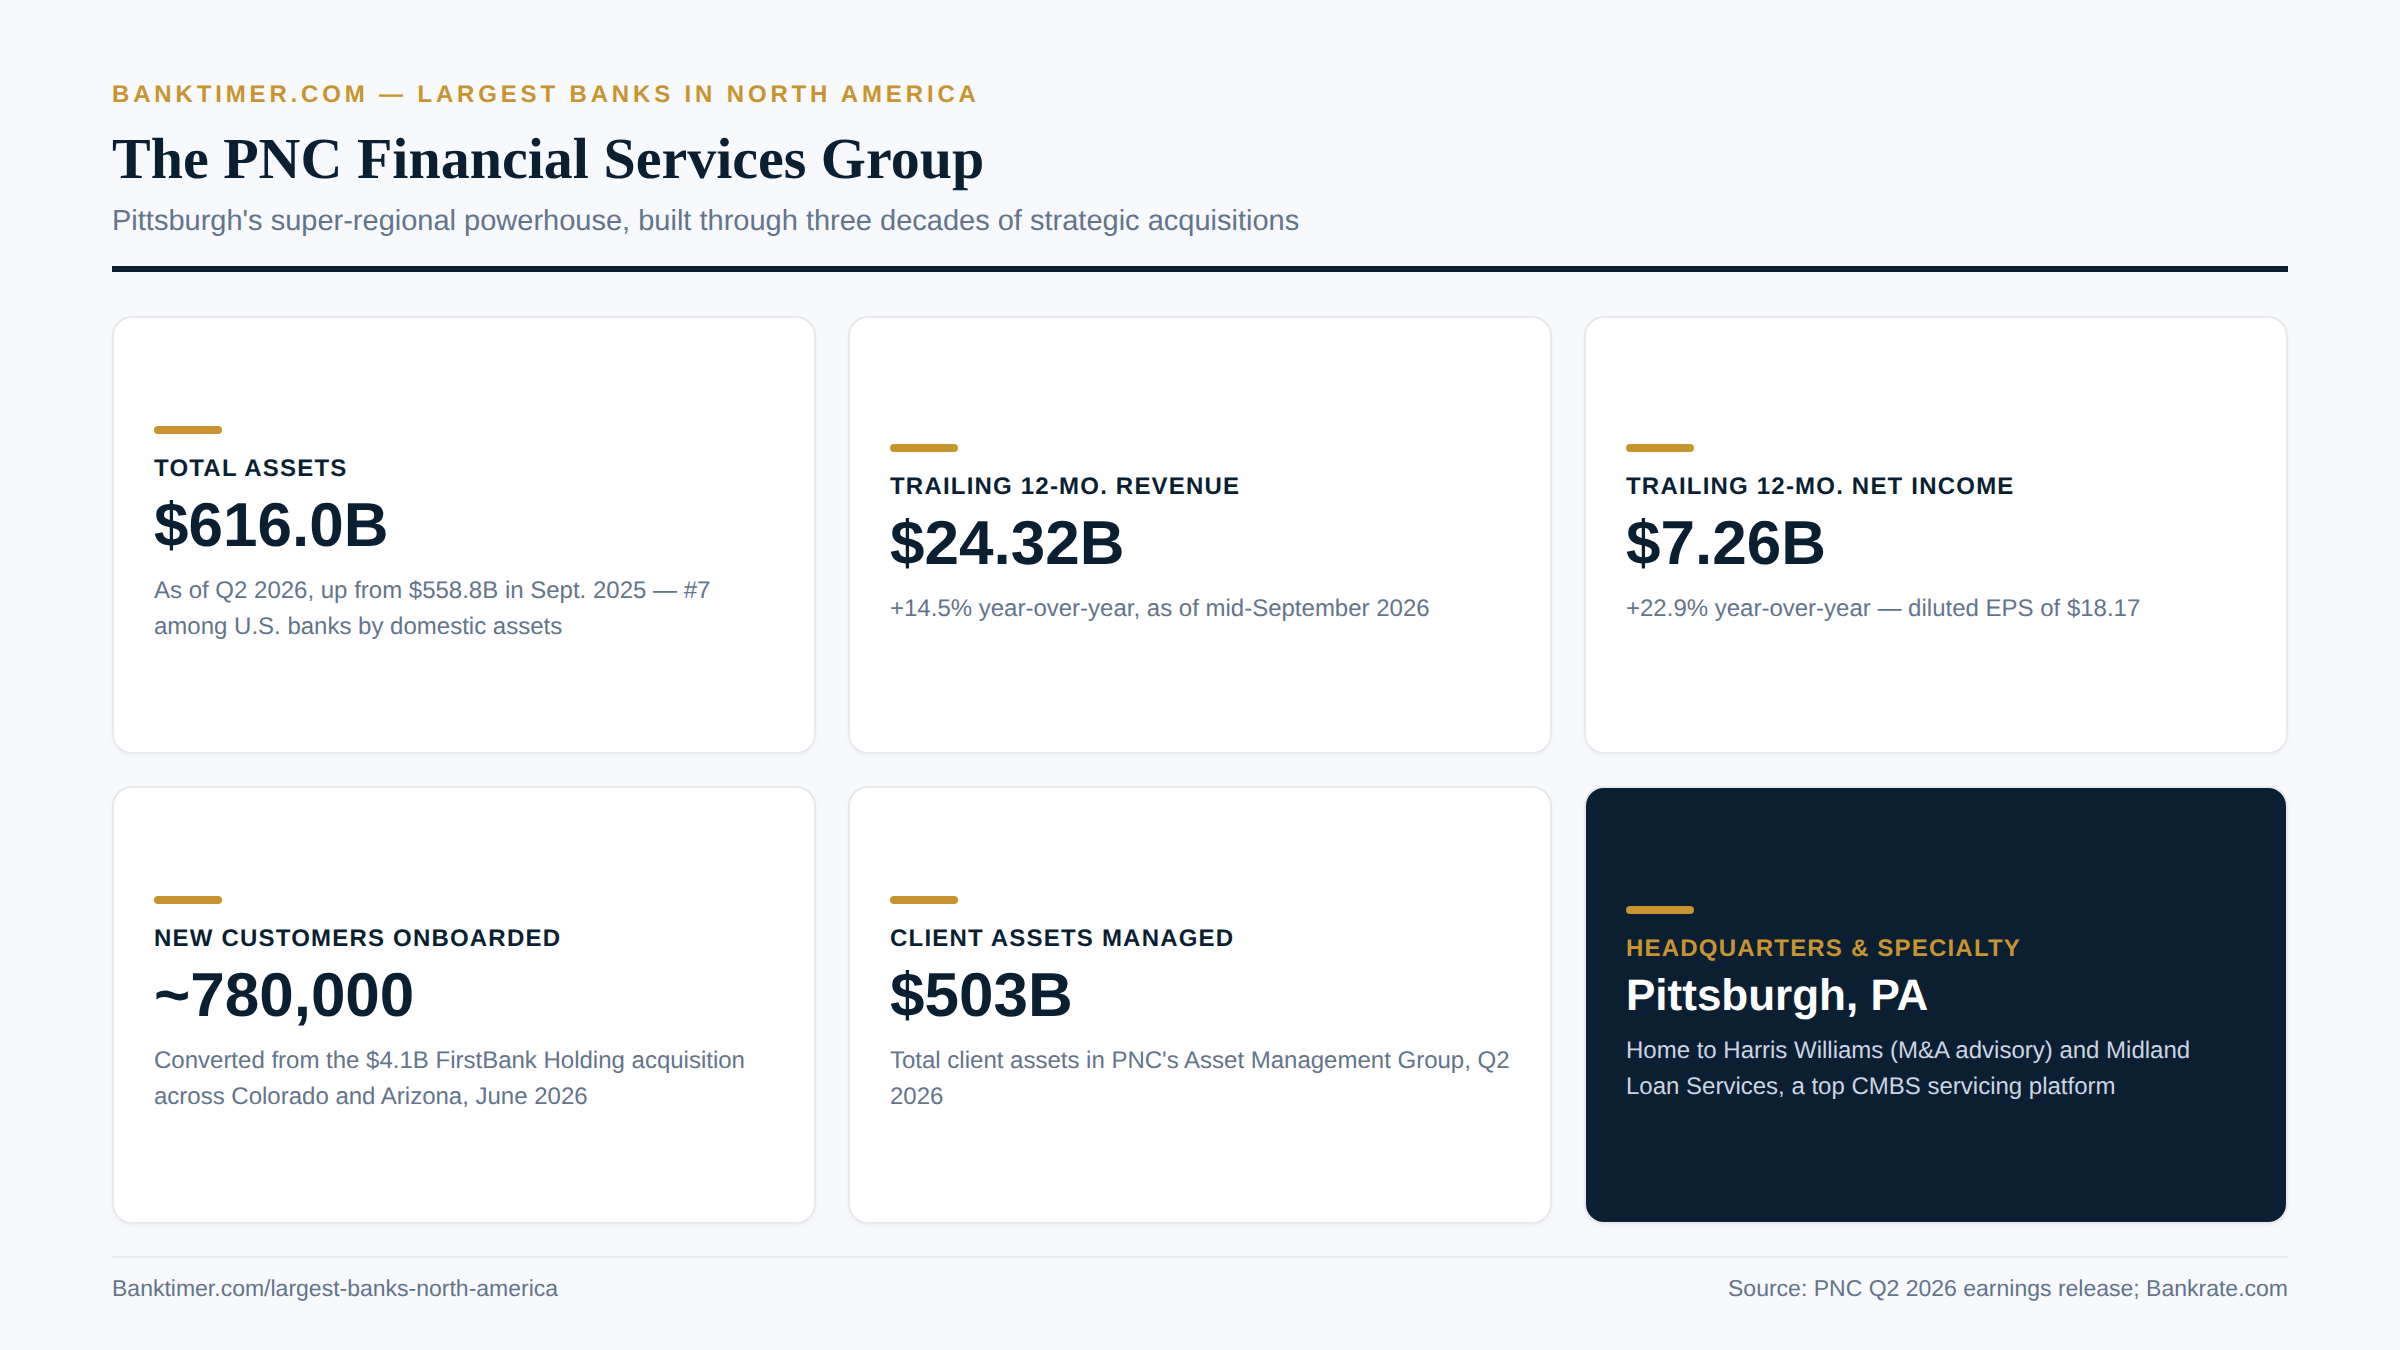
PNC just added 780,000 customers in one acquisition — here’s the scale behind it
Truist Financial
Truist Financial Corporation is the product of one of banking’s biggest “mergers of equals.” It was born on December 6, 2019. BB&T Corporation and SunTrust Banks combined forces that day, creating a new Southeast and Mid-Atlantic banking giant. The company’s lineage runs deep. BB&T traced its roots to an 1872 institution in Wilson, North Carolina. SunTrust descended from Georgia’s Trust Company, founded in 1891. The all-stock deal was valued at $66 billion when announced in February 2019.
That combination created a genuine heavyweight. Truist held $556.0 billion in total assets as of June 30, 2026. That places it comfortably among the ten largest commercial banks in the country.
It earns a spot on this list not just for size, but for how much has changed inside it recently. Truist just installed a new chief executive. It sold off its entire insurance brokerage arm. And it picked up outside recognition for its mobile banking app, all while running one of the larger branch networks in the Southeast and Mid-Atlantic. Even amid leadership change, Truist remains one of the largest banks in North America by branch footprint and balance-sheet size.
Corporate Profile & History
Founding, Headquarters, and Corporate Structure
BB&T and SunTrust announced their combination on February 7, 2019. It closed that December, forming what was then described as the eighth-largest U.S. bank by some measures, and the sixth-largest by consumer households served. The company adopted the Truist name in June 2019. It unveiled its blue-and-burgundy logo — blending SunTrust blue with BB&T burgundy — the following January.
Truist relocated its headquarters from Winston-Salem to Charlotte, North Carolina. It bought the former Hearst Tower, since renamed Truist Center, for roughly $455 million in a deal that closed in March 2020. The bank trades on the New York Stock Exchange under the ticker TFC. It describes itself as a “Top 10 U.S. commercial bank” in its own investor materials.
Major Mergers, Acquisitions, and Milestones
Integrating two large banks never comes cheap. The BB&T-SunTrust combination cost an estimated $4 billion to execute. Truist closed roughly 800 branches — about 4.8 million square feet of real estate — by early 2022, while chasing $1.6 billion in projected annual savings. The bank also stood up Truist Securities in June 2020 to house its investment banking and capital markets business.
The bigger recent story is what Truist gave up, not what it bought. In February 2024, the company agreed to sell its remaining stake in Truist Insurance Holdings. The buyer was an investor group led by Stone Point Capital and Clayton, Dubilier & Rice, and the deal valued the insurance brokerage at $15.5 billion. The sale closed alongside a broader balance-sheet repositioning, marking a deliberate pivot back toward core banking. In 2026, Truist went further, agreeing to sell $5.5 billion of auto loans. That move reportedly cuts its auto-lending book by roughly 40%.
Leadership and Governance
Truist’s leadership just turned over. The board announced on June 15, 2026 that Michael P. Lyons would become President and CEO, effective September 1, 2026 — meaning he has held the job for barely two weeks as of this writing. Lyons arrives from the CEO chair at Fiserv. Before that, he spent more than 13 years as president of PNC Financial Services Group, where he helped steer over $15 billion in strategic acquisitions.
Outgoing CEO Bill Rogers, who led Truist since its formation, isn’t leaving entirely. He becomes Executive Chair and plans to retire in April 2027. Lead independent director Thomas E. Skains has publicly credited Rogers with “purpose-driven leadership” through the difficult integration years. Choosing an outsider rather than promoting from within suggests something. The board wanted a fresh perspective for Truist’s next chapter, not simply a continuation of the post-merger cleanup.
Business Segments and Divisions
Truist organizes itself around two core reportable segments. One is Consumer and Small Business Banking. The other is Wholesale Banking — corporate and commercial banking, plus investment banking and trading conducted through Truist Securities. Insurance brokerage used to be a third pillar, but it disappeared from the org chart once the 2024 sale of Truist Insurance Holdings closed. The simplified structure reflects a bank betting on being excellent at fewer things, rather than spread thin across many.
Financial Performance & Scale
Total Assets and Balance Sheet Size
By the numbers, Truist is unmistakably a top-tier regional player. Total assets reached $556.0 billion as of June 30, 2026. That was built on $329.8 billion in gross loans and leases — a figure the company rounds to roughly $332 billion in its own investor materials.
Deposits told a similarly solid story. Noninterest-bearing balances of $104.3 billion plus $305.0 billion in interest-bearing deposits added up to about $409 billion total. Shareholders’ equity stood at $64.1 billion. The allowance for credit losses sat at $5.316 billion against $1.748 billion in nonperforming assets — a manageable ratio for a bank this size.
Annual Revenue and Net Income
Truist’s second quarter of 2026 showed real momentum. Net income hit $1,553 million, up sharply from $1,240 million a year earlier. Diluted earnings per share climbed to $1.23 from $0.90, a jump of roughly 37% year-over-year. First-half 2026 net income reached $3,034 million on diluted EPS of $2.31.
Net interest income for the quarter came in at $3,621 million. Noninterest income added $1,644 million, and provision for credit losses ran $395 million. On a trailing-twelve-month basis, Truist reported roughly $19.03 billion in revenue and $5.53 billion in net income, with EPS of $4.35. Analysts credited the quarter’s strength to trading activity and fee income, even as a flat net interest margin kept pressure on the bank’s core lending economics.
Customer Count and Market Share
Truist serves roughly 15 million clients across 17 states and Washington, D.C. It backs that footprint with more than 1,900 branches and over 2,800 ATMs. That keeps Truist concentrated in the Southeast and Mid-Atlantic rather than spread coast to coast. The company markets itself plainly as a “Top 10 U.S. commercial bank,” not a national one.
Stock Performance and Credit Ratings
Shares of Truist (NYSE: TFC) closed at $48.44 on September 16, 2026, down 4.00% that day. That gives the bank a market capitalization of roughly $59.18 billion. The stock has traded between $40.79 and $56.20 over the past 52 weeks. Its price-to-earnings ratio sits near 11.60, and it pays a dividend yield of about 4.29%. Wall Street’s consensus rating from 21 analysts sits at “Hold,” with an average 12-month price target of $54.92.
Credit agencies view Truist as solidly investment-grade. S&P rates the parent company’s senior debt A-. Moody’s rates it Baa1, and Fitch rates it A-, all with stable outlooks; the operating bank subsidiary carries slightly higher ratings across all three agencies. Moody’s had previously trimmed its view of Truist around the 2024 insurance-arm divestiture, though the outlook has since stabilized.
Products, Services & Specialties
Core Banking Products
Truist’s product shelf covers the fundamentals of everyday banking basics. Think personal checking and savings accounts, credit cards, mortgages, and auto loans, alongside small-business banking and wealth management. On the institutional side, Truist Securities handles corporate and commercial clients’ capital-markets needs. That gives the bank a genuine, if smaller-scale, investment-banking capability alongside its consumer business.
Specialty Divisions and Niche Strengths
Truist Securities, formed in June 2020, remains the bank’s clearest specialty push. It’s a dedicated investment banking and capital markets arm built to compete for corporate clients beyond simple lending. The company once ran one of the country’s largest insurance brokerages through Truist Insurance Holdings. It walked away from that business entirely in the 2024 sale. Instead, it chose to concentrate on being a strong super-regional bank across its 17-state footprint, rather than chase a coast-to-coast national presence.
Digital Banking and Technology
Truist’s digital push is paying off in outside recognition. Along with U.S. Bank, Truist topped Javelin Strategy & Research’s 2026 Digital Banking Scorecards — a notable nod given how crowded that competition has become. Industry coverage has also described Truist “pushing self-service as mobile dominates total transactions.” That’s a sign the bank is actively steering customers toward its app. Digital isn’t a secondary channel here. The Truist Mobile app remains its primary consumer-facing tool, though prospective customers should check current App Store ratings directly, since those shift over time.
Fees, Rates, and Customer Experience
Truist hasn’t escaped the industry-wide scrutiny over Zelle fraud. In July 2025, House Financial Services Committee Democrats sent CEO Bill Rogers a formal letter questioning the bank’s fraud protections on the peer-to-peer payment network. It was part of a broader wave. JPMorgan, Bank of America, and Wells Fargo were also touched — the CFPB separately sued all three over Zelle in December 2024. Truist itself wasn’t named in that federal lawsuit. Still, the congressional attention signals regulators are watching how well banks protect customers from payment scams, regardless of size.
Reputation, Risks & Recent Developments
Regulatory History and Compliance Record
Truist landed in regulators’ crosshairs in connection with a 2024 enforcement sweep, alongside TD Bank, BNY, and RBC. The issue: employees’ use of unmonitored messaging apps like WhatsApp for business communications — a recordkeeping violation the CFTC has pursued industry-wide. One source put Truist’s specific penalty at roughly $3 million. That figure comes from a single secondary outlet, though, and is worth confirming against the CFTC’s own order.
The bank has also had to reckon with its history. In July 2020, Truist publicly acknowledged that BB&T’s predecessor institutions had historical ties to slavery, a statement then-CEO Kelly King revisited again in 2022. Separately, Truliant Federal Credit Union sued Truist in 2019 over alleged brand confusion involving the “Tru-” naming convention. A court dismissed the case in August 2020.
Competitive Position and Differentiation
Truist occupies a specific competitive lane. It’s a super-regional bank built through a merger of equals, competing against PNC, Regions, Fifth Third, and U.S. Bank in its home Southeast and Mid-Atlantic markets, rather than battling JPMorgan or Bank of America nationally. It isn’t trying to be Capital One’s card-focused digital operation. And it isn’t chasing Goldman Sachs’s institutional trading business either.
The 2024 insurance-brokerage exit reinforced that positioning, funneling capital back into core deposit-taking and lending instead of fee-based side businesses. Choosing an outsider sends a signal, too. Lyons is fresh from running Fiserv after years at PNC. The board wants change agents for the next growth chapter, not simply a steady hand continuing the post-merger playbook.
Recent News and 2026 Developments
The past two years have been eventful. Truist closed the $15.5 billion sale of Truist Insurance Holdings in 2024, alongside a strategic balance-sheet repositioning. It followed in 2026 with an agreement to offload $5.5 billion in auto loans, cutting that book by roughly 40% to boost overall returns.
Leadership news dominated mid-2026. On June 15, the bank announced Michael Lyons as incoming CEO, effective September 1. Bill Rogers shifted to Executive Chair, ahead of his planned April 2027 retirement. Days later, Truist’s second-quarter earnings, reported around July 17, beat estimates. EPS was up 37% year-over-year on strong trading and fee income, even as net interest margin stayed flat. The bank also earned recognition alongside U.S. Bank in Javelin’s 2026 Digital Banking Scorecards.
Strengths, Weaknesses, and Who This Bank Suits
Truist’s case for a spot on this list rests on genuine scale and improving fundamentals. It’s a Top 10 U.S. bank with 1,900-plus branches, 15 million clients, an externally validated digital banking experience, and a stronger capital position after shedding its insurance arm. Fresh leadership under Lyons brings large-scale integration experience from PNC and the top job at Fiserv.
The weaknesses trace back to that same merger history. Truist cut its workforce by roughly 24.6% in 2024 alone, from 50,832 employees down to 38,335. It ticked back up slightly to 38,711 by the end of 2025. That’s a scar from years of costly integration. A flat net interest margin and ongoing Zelle-related scrutiny add further headwinds.
Truist suits consumers and small businesses inside its 17-state footprint who want full-service, branch-based banking with a genuinely strong app. It’s a weaker fit for anyone wanting the deepest wealth-management or investment-banking capability, or a purely digital, rewards-driven relationship better found at Capital One. New leadership aside, Truist’s branch network keeps it counted among the largest banks in North America.
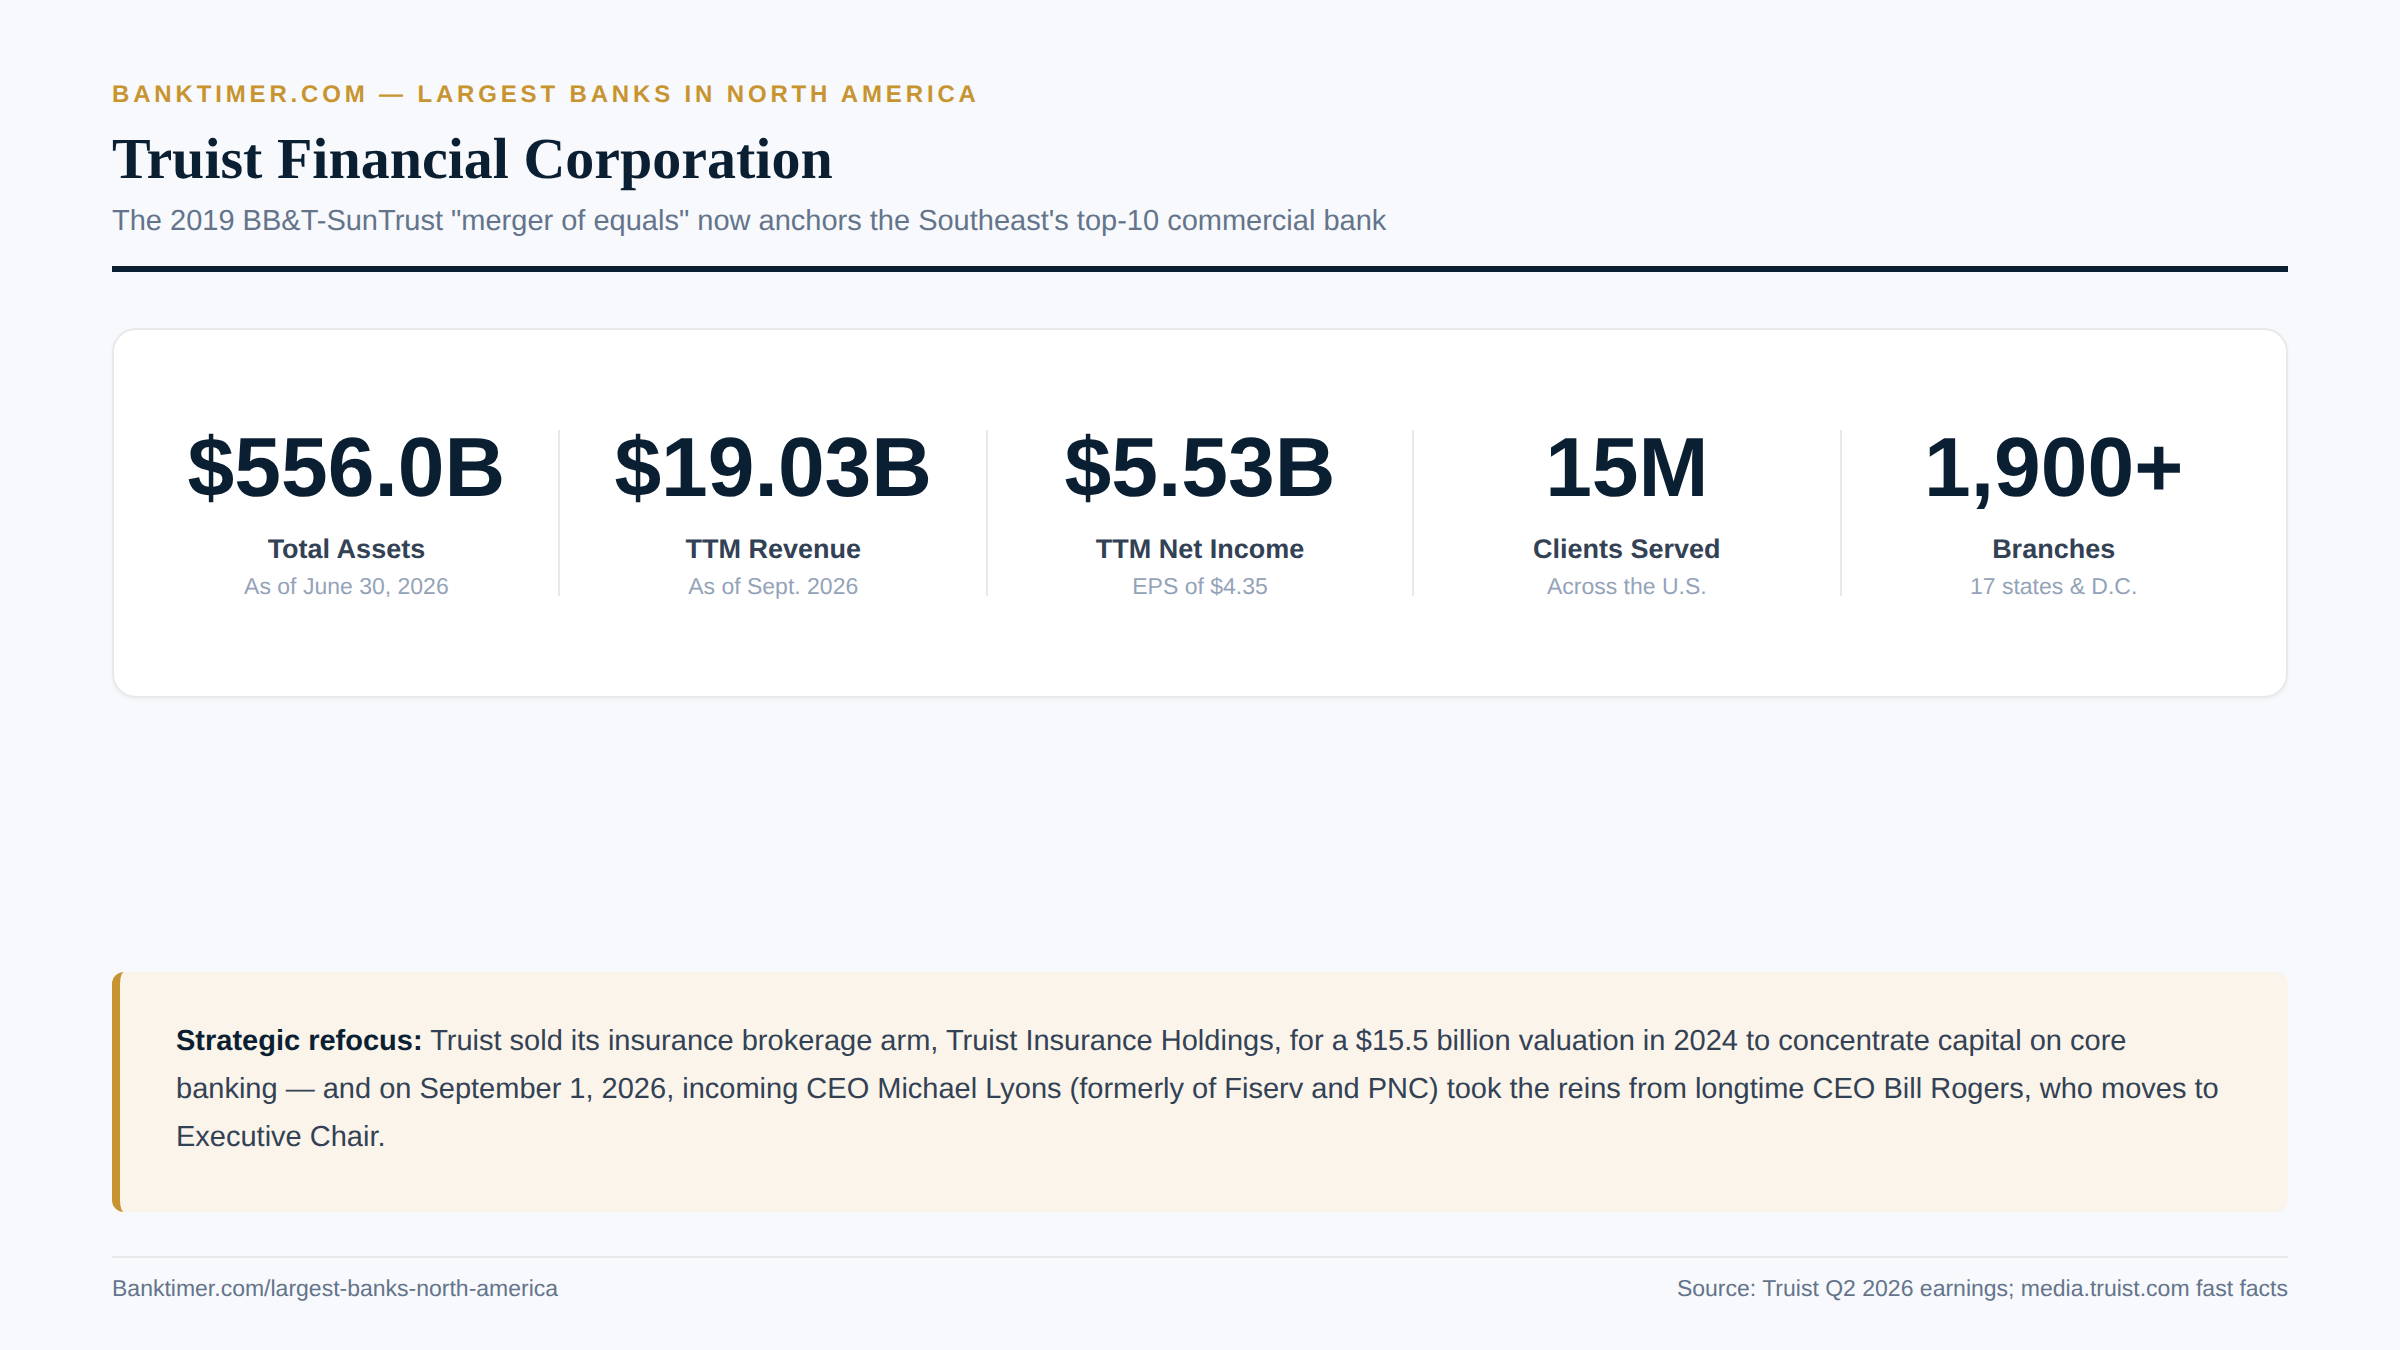
Truist just got a new CEO and $15.5B lighter — here’s where it stands now
Capital One
Capital One Financial Corporation started as a bet that data, not just deposits, could build a bank. Richard Fairbank and Nigel Morris pitched a data-driven credit-card strategy to Richmond’s Signet Bank in 1988. After a 1994 spinoff and October IPO, Capital One completed its separation in February 1995. More than three decades later, Fairbank still runs the company as founder, chairman, and CEO — a tenure almost unheard of among major U.S. banks.
Two enormous acquisitions have reshaped Capital One’s scale in barely a year. Total assets reached $673.8 billion as of June 30, 2026. That reflects the company’s acquisition of Discover Financial Services, and its subsequent purchase of business-payments platform Brex.
It belongs on this list because few banks have moved this fast. Capital One is now the largest U.S. credit card issuer by loans outstanding. It’s also one of a handful of issuers that owns its own payment network outright. Through Brex, it’s newly positioned as a serious player in business banking, too. The Discover deal alone reshaped where Capital One sits among the largest banks in North America.
Corporate Profile & History
Founding, Headquarters, and Corporate Structure
Capital One’s founding runs through an unusual detour. Fairbank and Morris developed their credit-card thesis in 1987 and convinced Signet Bank to launch Signet Financial in 1988. Signet announced a spinoff in July 1994 under the placeholder name “OakStone Financial.” It took the company public that October. The separation as Capital One was complete by February 1995.
The company is headquartered at Capital One Tower in Tysons, Virginia, with a European base in Nottingham, England. It trades on the New York Stock Exchange as COF. Capital One describes its own trajectory as growing “from a start-up to one of the ten largest banks in America and 100 largest companies… as ranked by Fortune Magazine.”
Major Mergers, Acquisitions, and Milestones
Capital One built much of its scale through acquisition long before Discover entered the picture. Notable deals include Hibernia National Bank for $4.9 billion in 2005 and North Fork Bank for $13.2 billion in 2006. ING Direct followed for $9 billion in 2011, rebranded Capital One 360 the next year. The 2011 purchase of HSBC’s U.S. credit card business, worth roughly $31.3 billion including loans and assets, expanded its card portfolio further.
None of that compares to the Discover Financial Services deal. Announced in February 2024, the all-stock transaction valued Discover at $35.3 billion. It closed on May 18, 2025, after stockholder votes and sign-off from the Federal Reserve, OCC, and Delaware regulators. Pro forma scale at close reached roughly $493.6 billion in total assets and $367.5 billion in deposits. The deal made Capital One the largest U.S. credit card issuer by outstanding loans and purchase volume. By the second quarter of 2026, CEO Richard Fairbank had an update for investors. The company was “14 months into our integration of Discover, and integration is going well,” he said. Even so, the quarter alone booked $298 million in integration expense.
Then came Brex. Capital One announced a $5.15 billion acquisition of the AI-native business-payments platform in January 2026. It closed the deal on April 7, 2026 — barely eleven months after Discover closed. Brex, founded in 2017, combines corporate credit cards, spend-management software, and banking services for businesses. It continues operating as a standalone platform inside Capital One, with co-founder Pedro Franceschi remaining as its CEO. Fairbank framed the logic simply. Brex’s “AI-native technology” pairs with “Capital One’s scale, sophisticated underwriting and iconic brand.”
Leadership and Governance
Fairbank isn’t just Capital One’s founder — he’s been its only CEO. He has run the company continuously since 1994 — more than three decades. That tenure stands out sharply against a banking industry where CEO turnover, as Truist just demonstrated, is far more common. His total compensation for 2025 was reported at roughly $40 million.
That longevity has drawn political scrutiny alongside admiration. Senator Elizabeth Warren has publicly questioned a CFPB nominee’s ties to Capital One, and to the agency’s since-dropped lawsuit against the company. That keeps Fairbank’s name in regulatory headlines even as the stock has performed well.
Business Segments and Divisions
Capital One organizes its business around three primary segments: Credit Card, Consumer Banking, and Commercial Banking. The Discover deal added something structurally rare — ownership of the Discover Network, Pulse, and Diners Club International payment rails. That makes Capital One one of the few U.S. issuers, alongside American Express, that controls its own end-to-end payment network rather than renting Visa’s or Mastercard’s. Brex now sits alongside these as a fourth, semi-independent vertical focused squarely on business payments.
Financial Performance & Scale
Total Assets and Balance Sheet Size
Capital One’s balance sheet has swelled dramatically. Total assets reached $673.8 billion by the second quarter of 2026. That reflects full Discover consolidation, ordinary organic growth, and the Brex acquisition layered on top. It compares with pre-merger scale of roughly $489 billion — meaning Discover alone added well over $150 billion in assets.
Total loans stood at $457.2 billion in the second quarter, up 2% from the prior quarter. Total deposits reached $484.3 billion, down slightly (1%) over the same period.
Annual Revenue and Net Income
Second-quarter 2026 net revenue came in at $15.9 billion, up 4% from the first quarter. Net income was $3.0 billion, with diluted earnings per share of $4.73. On a trailing-twelve-month basis, revenue reached $48.11 billion — more than double the prior year’s figure. Net income came to $10.20 billion, with EPS of $16.19.
That jump needs context. Discover only began consolidating into results on May 18, 2025, so comparisons through mid-2026 largely reflect the acquisition itself, rather than organic growth. Readers should treat the revenue surge as a merger effect, not a sudden doubling of the underlying business.
Customer Count and Market Share
Since closing Discover, Capital One has held the title of largest U.S. credit card issuer by loans outstanding and purchase volume. Its workforce reflects the same growth: 76,300 employees as of December 31, 2025, a 45% jump from 52,600 the year before. That growth came almost entirely from Discover employees joining the company.
Physical footprint remains modest relative to card scale. An estimated 750 bank branches and roughly 7,000 ATMs make up the network, plus its Capital One Cafe retail-banking hybrid locations. That count predates the merger, though, and is likely understated today.
Stock Performance and Credit Ratings
Capital One shares (NYSE: COF) closed at $203.19 on September 16, 2026, down 1.77% that day, for a market capitalization of roughly $124.65 billion. The stock has ranged between $174.24 and $259.64 over 52 weeks, and trades at a price-to-earnings ratio near 13.02. Analysts are notably bullish: a consensus “Buy” rating from 24 analysts carries an average price target of $258.27, implying roughly 27% upside.
Credit agencies affirmed their views after the merger closed. Moody’s rates Capital One Baa1 on long-term senior unsecured debt, and separately upgraded Discover’s own ratings to align with the combined company’s profile. S&P affirmed a BBB rating.
Products, Services & Specialties
Core Banking Products
Capital One’s card lineup spans Quicksilver, Venture, Venture X, and SavorOne, now joined by legacy Discover it cards under one roof. Beyond cards, the bank runs Capital One Auto Finance, small-business and commercial banking, and online deposit products including 360 Checking and 360 Performance Savings. Anyone getting oriented on credit card basics will find Capital One’s post-Discover lineup is now one of the broadest in the country.
Specialty Divisions and Niche Strengths
Owning the Discover payment network is Capital One’s single biggest strategic gain from the merger. It gives the bank the ability to process transactions on its own rails, instead of paying Visa or Mastercard for the privilege. That’s a structural edge shared meaningfully only with American Express. Diners Club International, also acquired through Discover, extends that network internationally.
Brex adds a different kind of specialty: an AI-native platform for startup and mid-market business banking, spend management, and corporate cards. It’s run independently under founder Pedro Franceschi, rather than folded into Capital One’s existing commercial bank. Smaller consumer tools like Capital One Shopping and Capital One Travel round out a fintech portfolio built through years of tuck-in acquisitions.
Digital Banking and Technology
Few banks have acquired fintech capability as aggressively as Capital One. Over the past decade it picked up Adaptive Path, Level Money, Paribus, Confyrm, Wikibuy (now Capital One Shopping), and BlueTarp Financial. More recently came travel-tech firm Hopper in 2025, and now Brex in 2026. On the migration front, Discover debit cards moved onto the Discover network first. A major wave of Discover credit-card accounts then migrated to Capital One’s website and app on July 27, 2026. The company is reportedly testing a longer-term move, too: putting some Capital One-branded cards onto the Discover network itself.
Outside validation backs up the investment. In J.D. Power’s 2026 U.S. Credit Card Satisfaction Study, Capital One’s Venture X Rewards ranked #2 among premium bank rewards cards. It scored 705, just behind American Express Platinum. Its Platinum Mastercard ranked #2 among no-fee cards.
Fees, Rates, and Customer Experience
Capital One’s savings-account practices triggered one of 2025’s more politically charged banking stories. In January 2025, the CFPB sued the company, alleging it cheated consumers out of more than $2 billion in interest. The alleged method: obscuring the gap between its higher-rate 360 Performance Savings account and its older, near-zero-rate 360 Savings account. Capital One marketed the newer product as its flagship, the CFPB said. The agency dropped the lawsuit in late February 2025 under new leadership, drawing sharp criticism from consumer advocates and Senator Elizabeth Warren.
A private class-action settlement filled some of that gap. Capital One agreed to pay $425 million to affected savings customers, approved around April 2026. New York’s attorney general filed a similar state-level suit in May 2025. For anyone weighing card offers in the aftermath, a balance transfer card is worth a look. Comparing it against Capital One’s own products is a reasonable place to start.
Reputation, Risks & Recent Developments
Regulatory History and Compliance Record
Capital One’s regulatory history runs long. In 2012, the OCC and CFPB fined the company $210 million over deceptive marketing of credit-card add-on products. It was notably the CFPB’s first-ever public enforcement action. A $75.5 million settlement followed in 2014 over unauthorized robocalls. A $100 million fine landed in 2018 for anti-money-laundering program failures.
Then came 2019’s data breach, one of the largest in U.S. banking history. A former Amazon Web Services engineer exploited a misconfigured firewall to access data on roughly 106 million individuals, including nearly 140,000 Social Security numbers. The Federal Reserve issued a cease-and-desist order that August, later lifted in 2023. In 2021, FinCEN fined Capital One $390 million over anti-money-laundering failures. The failures were tied to a check-cashing business it had once owned, covering roughly $16 billion in unreported cash transactions.
More recently, 2025 brought the CFPB’s since-dropped $2 billion interest-rate lawsuit and the $425 million settlement that followed. A separate “debanking” suit from Trump-affiliated entities, over 2021 account closures, followed. It was dismissed without prejudice in March 2026, meaning it could still be refiled.
Competitive Position and Differentiation
Post-Discover, Capital One occupies a unique competitive spot. It’s the largest U.S. credit card issuer, and one of the only major issuers besides American Express to own its payment network end-to-end. That’s fundamentally different from Truist’s branch-based super-regional approach or Goldman Sachs’s institutional focus. Capital One competes as a technology- and data-driven card specialist that has spent three decades acquiring fintech capability.
Closing the Discover and Brex deals within eleven months of each other represents unusually aggressive expansion, even by Capital One’s historically acquisitive standards. Few banks execute two multibillion-dollar acquisitions back to back without stumbling. The next few quarters will show whether Capital One can integrate both smoothly.
Recent News and 2026 Developments
The timeline of the past eighteen months reads like a highlight reel. The Discover acquisition closed May 18, 2025, immediately making Capital One the largest U.S. credit card issuer. The CFPB’s $2 billion lawsuit rose and fell between January and February 2025. Capital One announced the Brex acquisition in January 2026 and closed it that April 7. March 2026 brought the dismissal of the Trump Organization debanking suit. April 2026 saw approval of the $425 million savings settlement.
By July 27, 2026, Discover cardholder accounts had migrated onto Capital One’s website and app. The company then posted second-quarter results, reported around July 21: $3.0 billion in net income. Management described Discover integration as “going well” fourteen months in.
Strengths, Weaknesses, and Who This Bank Suits
Capital One’s strengths are substantial. It’s the largest U.S. card issuer by scale, with rare ownership of a proprietary payment network and decades of data-driven underwriting experience. Add a new small-business banking capability through Brex, plus a bullish analyst consensus with roughly 27% implied upside.
The weaknesses cluster around risk and history. A long regulatory record doesn’t help. There’s the 2012 marketing fine, 2018 and 2021 AML penalties, the 2019 data breach, and the unresolved politics around the dropped 2025 CFPB case. That sits alongside real integration risk, too, from two large acquisitions closing within a year of each other. Its customer base also skews more toward subprime and near-prime credit than a bank like Truist, which can mean sharper losses in a downturn.
Capital One suits consumers and small businesses who want a rewards-rich, digitally native card and online banking relationship, rather than a branch on every corner. Through Brex, it also suits startups needing an integrated corporate card and spend-management platform. It’s a weaker fit for anyone wanting full-service wealth management, investment banking, or in-person branch banking. Post-merger scale now puts Capital One among the largest banks in North America by both assets and card volume.
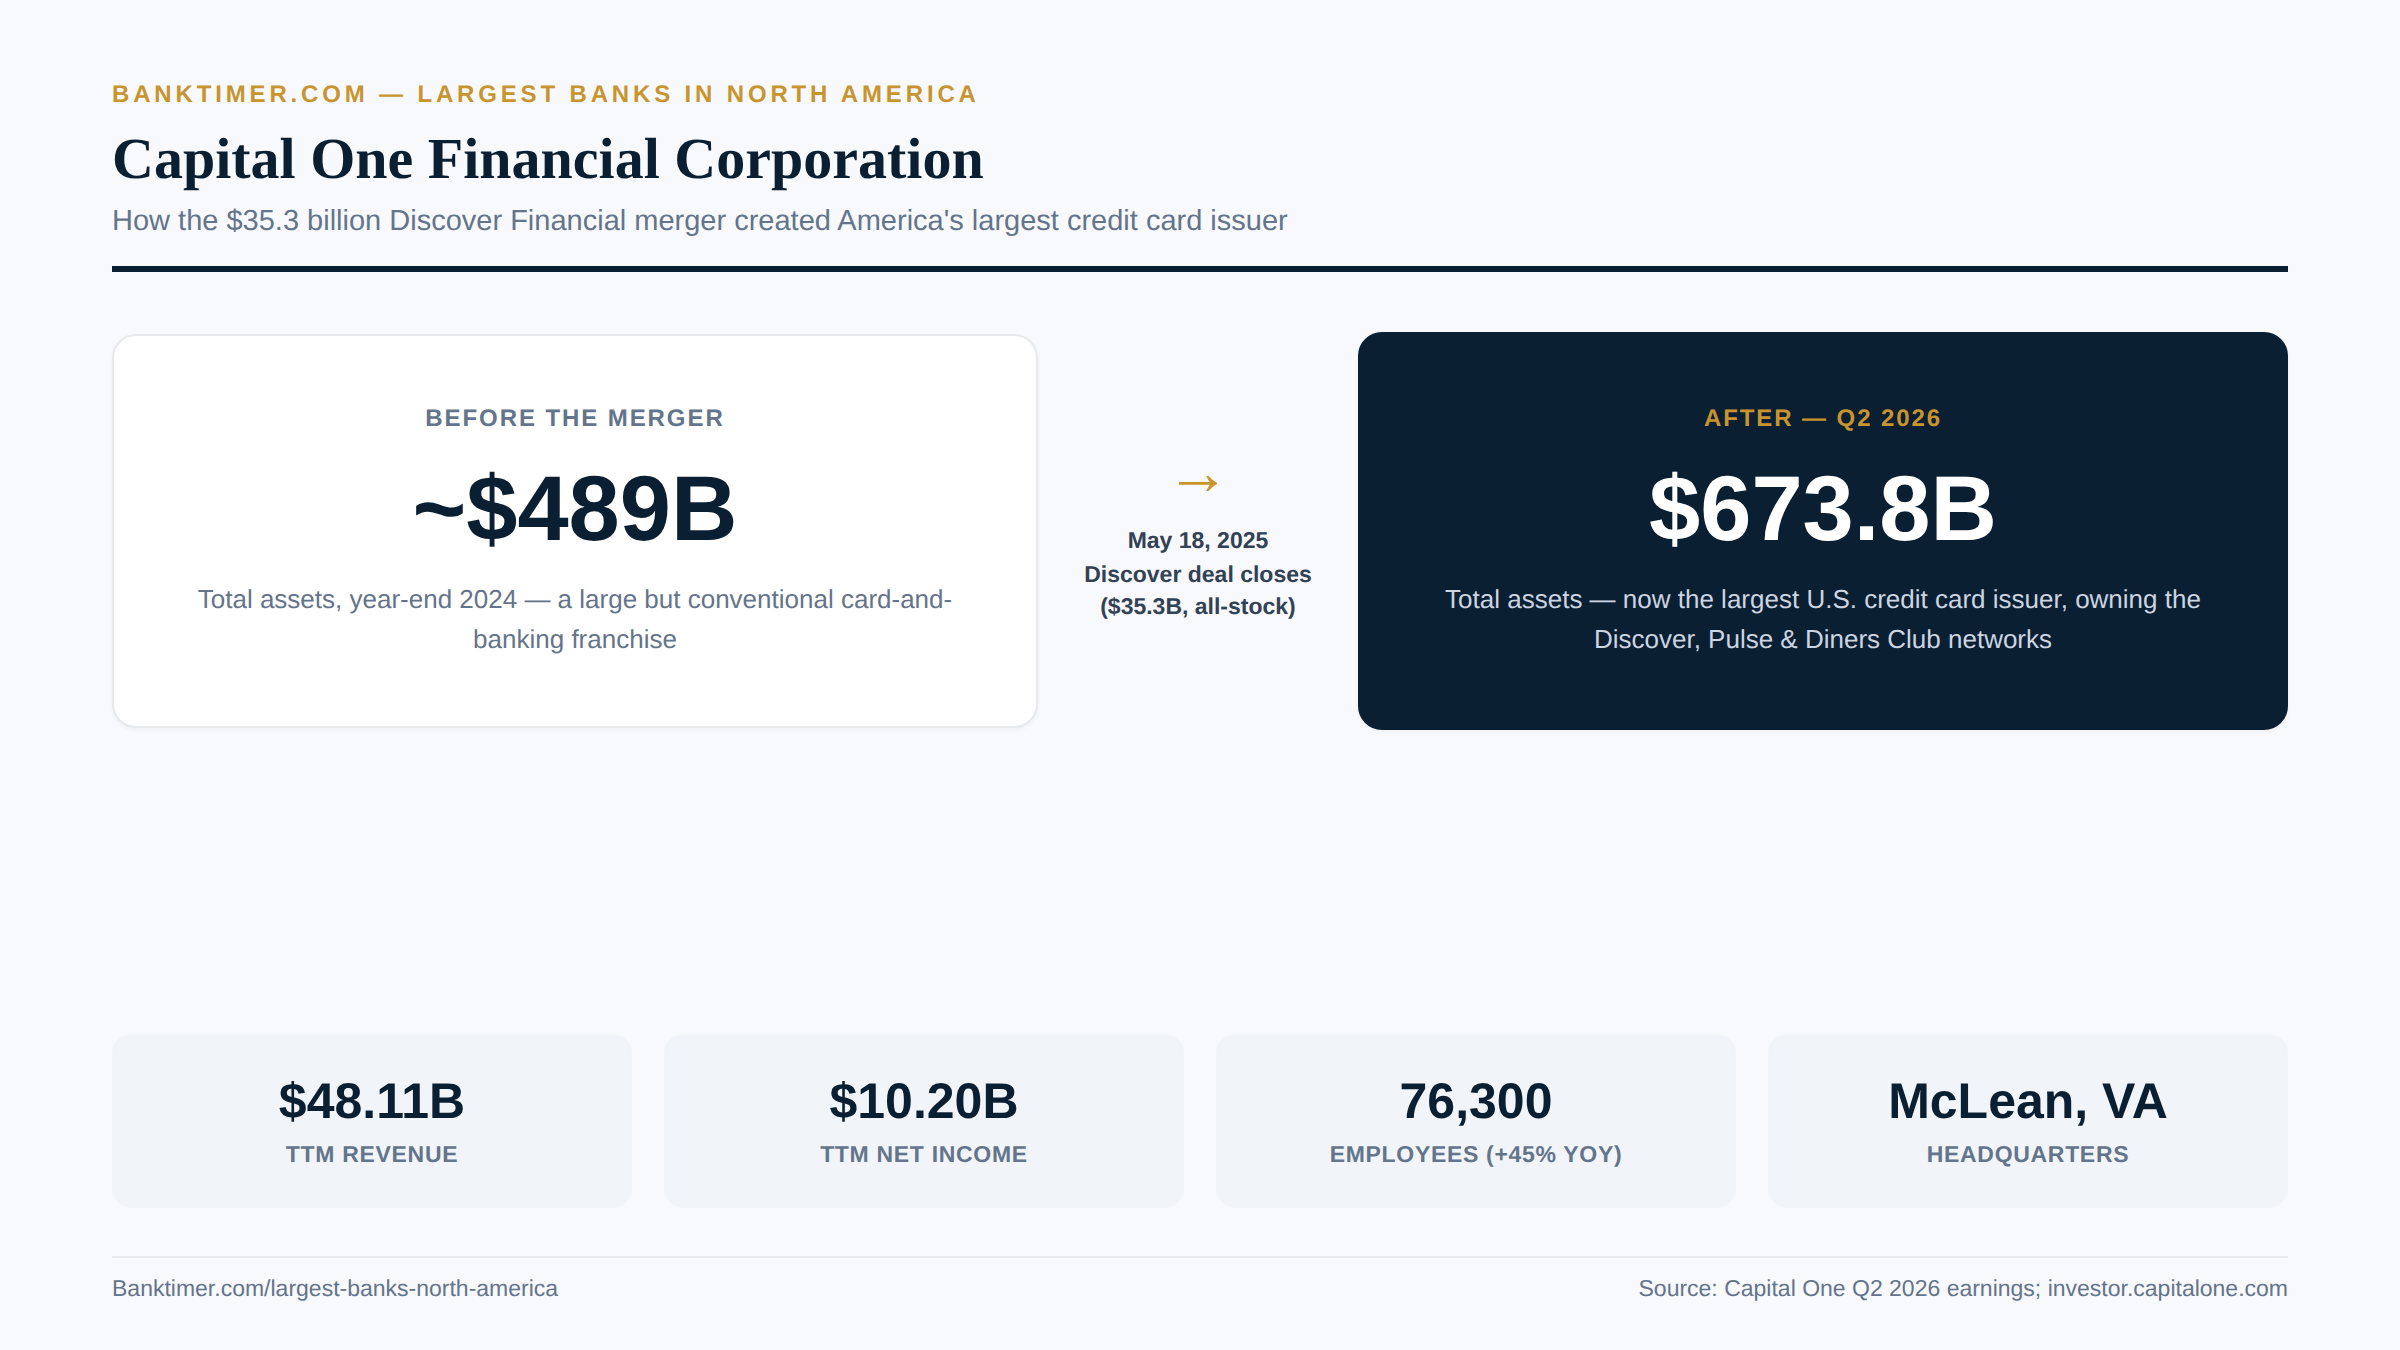
One merger, $185 billion more in assets — Capital One’s Discover deal by the numbers
Goldman Sachs
The Goldman Sachs Group has been reinventing itself since Marcus Goldman opened a small commercial-paper trading operation in Manhattan in 1869. Samuel Sachs joined in 1882, lending the firm the name it carries today. Goldman went public in May 1999, selling roughly 12.6% of itself to outside investors at $53 a share. It converted to a bank holding company in September 2008 during the financial crisis. That shift let it tap Federal Reserve lending facilities. It also secured a $5 billion capital injection from Berkshire Hathaway and a $10 billion Treasury investment, which it repaid by June 2009.
Total assets reached $1.81 trillion in fiscal 2025. Assets under supervision exceeded $3 trillion, with one estimate citing $3.61 trillion. Those numbers place Goldman in a different category from Truist or Capital One. It isn’t a retail deposit bank competing for checking accounts, but a global investment bank and asset manager.
Goldman belongs on this list for scale and influence. It ranks #32 on the Fortune 500 and #19 on the Forbes Global 2000. But it also belongs here for a genuinely newsworthy pivot. Goldman spent a decade chasing mass-market consumer banking through Marcus and the Apple Card. Now it’s walking away from that business entirely, handing the Apple Card program to JPMorgan Chase by 2028. Even without a retail branch network, Goldman Sachs ranks among the largest banks in North America by balance-sheet size and influence.
Corporate Profile & History
Founding, Headquarters, and Corporate Structure
Goldman Sachs is headquartered at 200 West Street in Manhattan’s Battery Park City. That’s a long way, literally and figuratively, from the commercial-paper business Marcus Goldman started in 1869. The firm’s 1999 IPO, priced at $53 a share, turned a storied private partnership into a public company. Its 2008 conversion to a bank holding company, during the Lehman Brothers crisis, fundamentally changed its regulatory identity. That subjected it to Federal Reserve oversight for the first time.
Goldman trades on the NYSE as GS and sits in the S&P 500, the Dow Jones Industrial Average, and the S&P 100. Regulators classify it as a globally systemically important financial institution. That designation is reserved for banks whose failure could threaten the broader financial system.
Major Mergers, Acquisitions, and Milestones
Goldman’s acquisition history tells the story of a decade-long detour into consumer finance, followed by a retreat. The firm launched Marcus by Goldman Sachs in 2016, offering no-fee personal loans directly to consumers. It extended that push in March 2019 by announcing the Apple Card partnership. Goldman bought home-improvement lender GreenSky for $2.24 billion in 2021. It also picked up asset manager NN Investment Partners for €1.7 billion that year, then retirement-technology firm NextCapital in 2022.
By 2023, Goldman had reorganized into two primary segments and visibly began retreating from consumer banking. That retreat became official in January 2026. Goldman announced JPMorgan Chase would take over as Apple Card issuer, with the transition completing by 2028. Coverage at the time described it as Goldman “closing the chapter on its consumer foray.”
Goldman’s more recent deals point squarely back toward its institutional roots. It acquired ETF platform Innovator Capital for about $2 billion in April 2026. That business runs roughly 171 funds and $31 billion in assets under management. In August 2026, it agreed to buy options-income ETF specialist NEOS for up to $2.25 billion.
Leadership and Governance
David M. Solomon has chaired Goldman’s board since October 2018 and served as CEO since January 2019. That’s roughly seven to eight years running the combined role as of 2026. His total compensation for 2025 was reported at approximately $118.9 million. President and COO John Waldron, widely seen as Solomon’s likely successor, earned a nearly identical $118.1 million the same year. That’s an unusual degree of pay parity between a CEO and his second-in-command.
CFO Denis Coleman has held his role for roughly 4.7 years. Lead independent director David Viniar is Goldman’s former longtime CFO. He brings nearly 14 years of board experience and a substantial personal stake in the company. Unlike Truist, Goldman shows no sign of imminent leadership change.
Business Segments and Divisions
Goldman now runs primarily through two GAAP reporting segments. Global Banking & Markets houses investment-banking advisory work, FICC and equities trading, and prime brokerage. It also runs the Marquee institutional trading platform and a transaction-banking unit for corporate treasury clients. Asset & Wealth Management covers public and private-market asset management, alongside wealth management for ultra-high-net-worth clients, family offices, and executives. It delivers that through Private Wealth Management, Private Banking and Lending, and executive-counseling arm Ayco.
A smaller Platform Solutions unit historically embedded financial products like the Apple Card into partner ecosystems. That’s the very business now being wound down as Goldman exits consumer banking.
Financial Performance & Scale
Total Assets and Balance Sheet Size
Goldman closed fiscal 2025 with $1.81 trillion in total assets. Its assets under supervision — money managed on behalf of clients, rather than held on its own balance sheet — topped $3 trillion. One figure cites $3.61 trillion specifically. Its Tier 1 capital ratio has been reported around 14.8%. That figure moves quarterly, though, and is worth checking against the most current filing.
Annual Revenue and Net Income
Goldman’s 2026 results have accelerated quarter over quarter. Second-quarter net revenue reached $20,236 million, with net earnings of $6,382 million. That translates to diluted EPS of $20.98 and an annualized return on equity of 23.5%. First-quarter revenue was $16,912 million, with net income of $5,388 million. Both figures were up meaningfully from 2025’s quarterly range of roughly $14.2 billion to $15.6 billion in revenue.
Full-year 2025 revenue landed somewhere around $58 billion to $61 billion, depending on the source, with net income near $16.3 billion. Sources differ slightly on the exact revenue figure, likely due to how net interest expense gets presented. On a trailing-twelve-month basis through mid-September 2026, Goldman reported roughly $67.57 billion in revenue and $19.98 billion in net income.
Customer Count and Market Share
Traditional retail metrics like customer counts and branch market share don’t really apply to Goldman Sachs, because it isn’t a mass-retail bank. Its client base is institutional: corporations, governments, financial institutions, and asset owners. It also serves ultra-high-net-worth individuals and family offices through wealth management.
That focus is becoming sharper, not broader. By exiting Marcus and the Apple Card, Goldman is formally stepping away from its one true mass-consumer product line. Its real “market share” shows up in investment-banking league tables and trading volume, not in checking-account counts.
Stock Performance and Credit Ratings
Goldman shares (NYSE: GS) closed at $937.98 on September 16, 2026, down 3.96% that day, for a market capitalization of $283.99 billion. The stock’s 52-week range spans $740.01 to $1,153.99. Its price-to-earnings ratio sits at 14.51, with a 2.13% dividend yield on a $20.00 annual payout.
Credit rating agencies rate Goldman solidly investment-grade: S&P at BBB+, Moody’s at A2, and Fitch at A. Ratings can differ between the holding company and Goldman Sachs Bank USA, though, so readers should confirm which entity a given rating covers.
Products, Services & Specialties
Core Banking Products
Goldman isn’t a checking-and-savings retail bank in any conventional sense. Its closest analogues are Goldman Sachs Bank USA and Marcus. Goldman Sachs Bank USA houses remaining deposit and lending products. Marcus, its no-fee personal-loan brand, is now being wound down as a mass-market product. Ayco’s executive financial counseling rounds out the list. The real “core products” sit on the institutional side. Think M&A advisory, equity and debt underwriting, FICC and equities trading, prime brokerage, and asset and wealth management.
Specialty Divisions and Niche Strengths
Global Banking & Markets remains Goldman’s historic strength. It’s a top-tier global franchise in M&A advisory and securities underwriting, backed by deep trading operations in fixed income, currencies, commodities, and equities. Asset & Wealth Management serves ultra-high-net-worth clients and institutions, and it just got bigger through the Innovator Capital and NEOS ETF acquisitions. That’s a clear bet on scaling the ETF platform as a growth engine.
Platform Solutions, the unit that ran Apple Card, is being scaled back following the JPMorgan transition. It’s a rare instance of an elite institutional bank publicly retreating from a consumer-technology strategy after roughly a decade of investment.
Digital Banking and Technology
Marquee, Goldman’s institutional digital-markets platform, gives corporate and institutional clients trading tools, risk analytics, and data access. Transaction Banking, launched in 2020, targets corporate treasury clients in direct competition with JPMorgan’s and Citi’s cash-management businesses.
Marcus was meant to be Goldman’s consumer-technology breakthrough when it launched in 2016. But the January 2026 decision to hand Apple Card to JPMorgan by 2028 effectively ends that chapter. No J.D. Power retail-banking or credit-card ranking applies to Goldman the way it does to Capital One. Its business simply isn’t built around mass-market digital banking — and that’s by design now, not by accident.
Fees, Rates, and Customer Experience
Fee schedules and satisfaction surveys mean little at Goldman’s scale of business. There’s no mass consumer fee structure to speak of, since the firm is actively exiting that space. What passes for “customer experience” here is institutional and ultra-high-net-worth service. It’s judged by relationship-manager quality and investment performance, rather than app ratings or overdraft policies. Marcus, while it lasted, marketed no-fee personal loans and competitive high-yield savings rates as its consumer hooks, before the 2023–2026 wind-down began.
Reputation, Risks & Recent Developments
Regulatory History and Compliance Record
Few banks carry a regulatory rap sheet as expensive as Goldman’s. In 2003, it paid $110 million as part of a multi-firm settlement. The issue: conflicts between equity research and investment banking during the dot-com era. In 2010, the SEC charged Goldman and a vice president over the Abacus 2007-AC1 synthetic CDO. The allegation: Goldman hid that hedge fund Paulson & Co. had helped select — and was betting against — the underlying portfolio. Goldman settled for $550 million that July, without admitting wrongdoing.
The Department of Justice extracted $5.06 billion from Goldman in 2016 over misrepresented mortgage-backed securities sold before the 2008 crisis. Then came the firm’s most damaging episode: the 1MDB scandal. Goldman underwrote roughly $6.5 billion in bonds for a Malaysian sovereign wealth fund between 2011 and 2013, earning about $600 million in fees. Prosecutors alleged the firm ignored red flags that enabled a multibillion-dollar theft.
Goldman settled in October 2020 for $2.9 billion across the U.S., Malaysia, Singapore, and the U.K. Its Malaysian subsidiary pleaded guilty to a criminal charge. No comparable enforcement action surfaced in 2025 or 2026 — recent headlines have focused on M&A activity and the Apple Card exit instead.
Competitive Position and Differentiation
Goldman Sachs competes in a different arena entirely from Truist or Capital One. Its real rivals are Morgan Stanley and the investment-banking and trading arms of JPMorgan, Bank of America, and Citigroup. Regional banks and card issuers chasing retail deposits simply aren’t in the same game.
The Marcus and Apple Card experiment showed the limits of translating an elite institutional franchise into commoditized consumer finance. The 2023 reorganization shows that clearly. So does the 2026 M&A pattern of Innovator Capital and NEOS. Both point to a recommitment to banking, markets, and wealth management for institutions and the wealthy. That focus comes with volatility, too. A 23.5% annualized return on equity in the second quarter of 2026 reflects strong capital-markets conditions. Those conditions can just as easily turn against the firm in a downturn.
Recent News and 2026 Developments
January 2026 brought Goldman’s biggest recent headline: the decision to exit the Apple Card business. The issuer role goes to JPMorgan Chase, with a transition completing by 2028. Two ETF deals followed. The roughly $2 billion Innovator Capital acquisition closed in April 2026, adding about 171 funds and $31 billion in assets under management. The up-to-$2.25 billion agreement to buy NEOS followed in August 2026.
Financially, momentum has been strong throughout. Second-quarter 2026 net revenue hit $20.2 billion, with EPS of $20.98 and a 23.5% annualized return on equity. That extended a multi-quarter climb from roughly $14.8 billion in first-quarter 2025 revenue. Leadership has stayed stable throughout, with Solomon continuing as Chairman and CEO and no succession announcement on the horizon.
Strengths, Weaknesses, and Who This Bank Suits
Goldman’s strengths sit squarely in its institutional core. It has an elite global brand in M&A advisory and underwriting, plus deep and highly profitable trading operations. Its asset-management platform is growing, too, freshly expanded through the Innovator Capital and NEOS deals. Recent profitability stands out as well, with second-quarter 2026 return on equity at 23.5%.
The weaknesses are just as notable. A history of very large, reputationally damaging settlements doesn’t help, either. The $2.9 billion 1MDB case and the $5.06 billion 2016 mortgage-securities settlement point to periodic lapses in risk control. The abandoned Marcus and Apple Card strategy also shows the firm struggled to translate institutional strength into mass-market retail banking. Its earnings run far more cyclical than a deposit-funded bank’s, too, tied tightly to deal volume and market conditions.
Goldman suits corporations and governments needing M&A advisory or capital-markets access, plus institutional investors. On the wealth side, it suits ultra-high-net-worth individuals, family offices, and corporate executives seeking sophisticated private wealth management. It’s a poor fit for an everyday consumer who just wants a checking account or a branch to walk into. Goldman has explicitly exited that business. Its consumer-banking exit hasn’t changed where Goldman Sachs sits among the largest banks in North America by balance-sheet size.
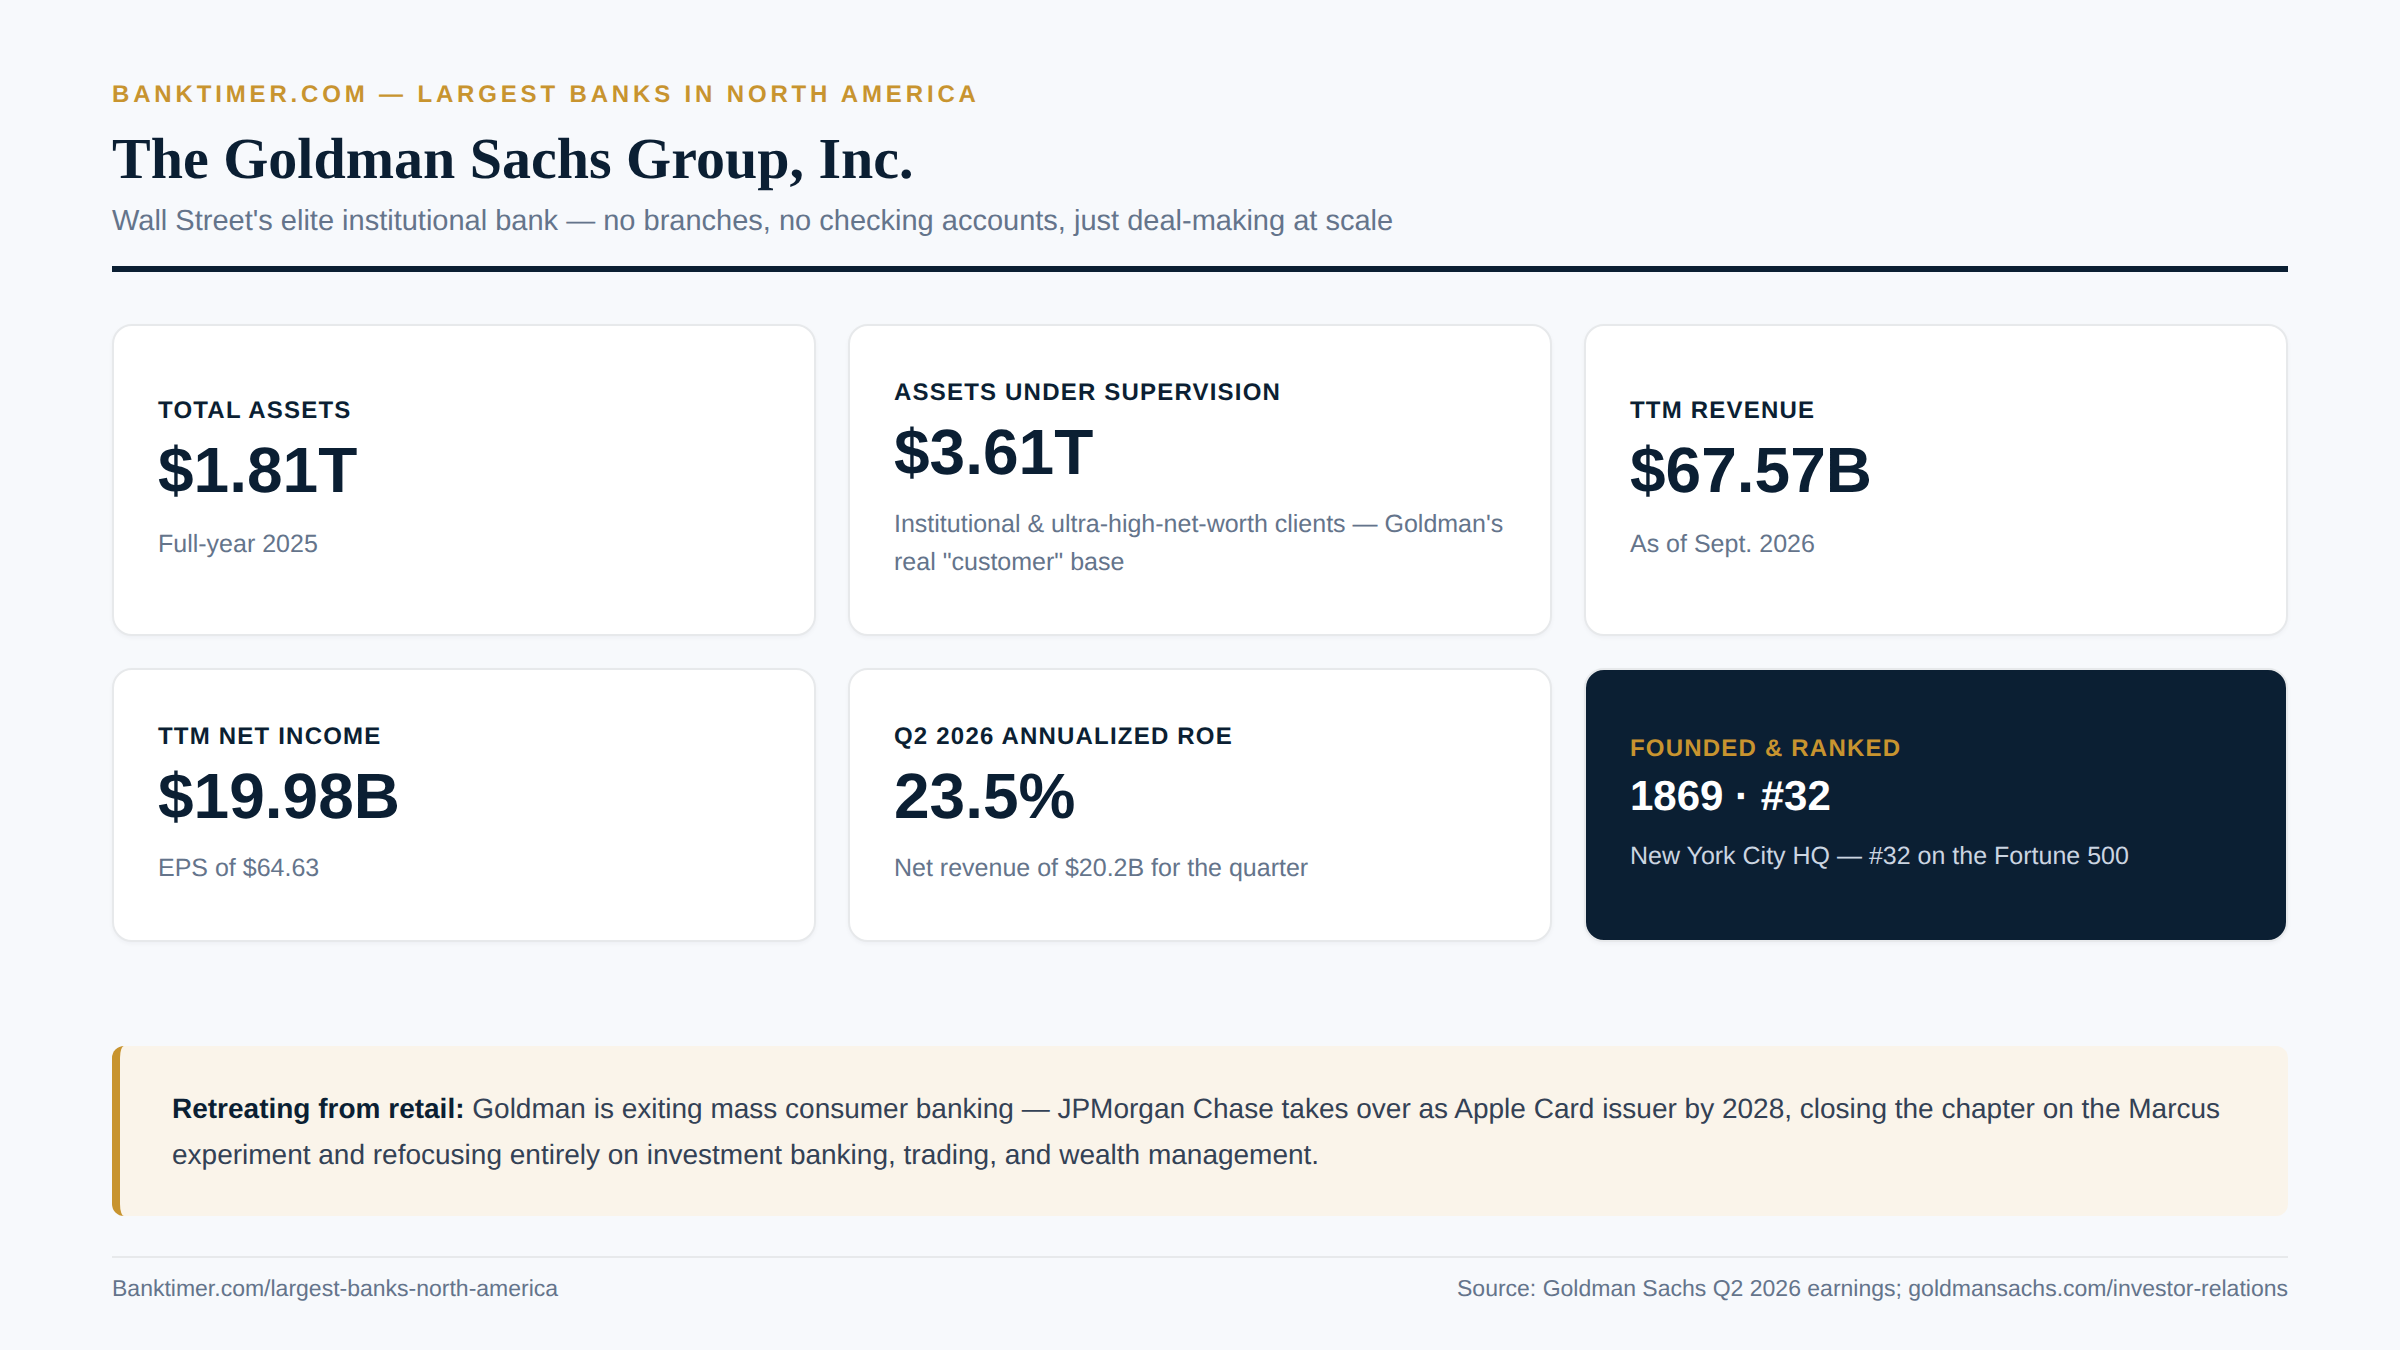
No branches, no checking accounts — just $3.6 trillion in client assets
Morgan Stanley
Morgan Stanley is one of Wall Street’s original investment banks. Its founding story is tangled up with the law that reshaped American finance. The Glass-Steagall Act of 1933 forced J.P. Morgan & Co. to split its commercial and investment banking businesses. Henry Sturgis Morgan — a grandson of J.P. Morgan himself — teamed up with Harold Stanley to launch the new firm on September 16, 1935. They opened their first office at 2 Wall Street. Nine decades later, the company runs from 1585 Broadway in Midtown Manhattan. It trades on the New York Stock Exchange under the ticker MS. It also operates as a Federal Reserve-regulated bank holding company.
The number that best captures Morgan Stanley’s current scale isn’t a balance-sheet figure at all. It’s client money. The firm now oversees more than $10 trillion in total client assets. It crossed that milestone for the first time in the second quarter of 2026. That total spans multigenerational family fortunes on one end. On the other, it includes E*TRADE accounts opened by first-time investors.
Morgan Stanley belongs on any list of North America’s largest banks. But not for the reasons a typical retail bank does. It has no meaningful branch network and takes almost no consumer deposits. Instead, it earns its scale through wealth management fees, investment banking deals, and institutional trading. That fee-driven model behaves very differently from a lending-heavy regional bank. It’s worth understanding on its own terms. That combination of scale and specialization is exactly why Morgan Stanley belongs on any serious list of the largest banks in North America.
Corporate Profile & History
Founding, Headquarters, and Corporate Structure
The firm’s 1935 founding was a direct consequence of Glass-Steagall’s break-up of the original J.P. Morgan & Co. Henry Sturgis Morgan and Harold Stanley built a pure investment bank from scratch. The Morgan name carried real weight from day one. New York City has hosted the headquarters ever since. The current address, 1585 Broadway, sits in the heart of Times Square.
Morgan Stanley converted to bank holding company status in September 2008, during the worst days of the financial crisis. Rival Goldman Sachs made the same move the same week. The new status gave both firms access to Federal Reserve support, in exchange for tighter oversight. Japan’s Mitsubishi UFJ Financial Group invested $9 billion in Morgan Stanley around the same time. It has remained a major strategic shareholder ever since, historically holding somewhere near 20% to 23% of the company.
Major Mergers, Acquisitions, and Milestones
Morgan Stanley’s name has changed twice. A 1997 merger with Dean Witter, Discover & Co. created “Morgan Stanley Dean Witter.” The combination paired investment banking with a large retail brokerage network. The combined name didn’t last; the firm reverted to plain “Morgan Stanley” in 2001.
Two later acquisitions reshaped the business far more than that name change ever did. In October 2020, Morgan Stanley closed a $13 billion acquisition of E*TRADE Financial. That deal instantly added a direct-to-consumer brokerage and banking platform the firm had never operated before. Five months later, in March 2021, it completed the purchase of asset manager Eaton Vance. That broadened its Investment Management division well beyond its traditional institutional client base.
More recent dealmaking has been smaller and opportunistic rather than transformative. Through 2026, Morgan Stanley Real Estate Investing kept adding bolt-on property deals. Two examples: a Florida seniors-housing portfolio, and a Kansas City distribution facility purchased for roughly $158.5 million.
Leadership and Governance
Ted Pick became chief executive on January 1, 2024, succeeding James Gorman after Gorman’s 13-year run atop the firm. A year later, Pick also took the chairman title, consolidating both top governance roles under one leader. Gorman stayed on as chairman emeritus, a link between the two eras.
Pick doesn’t run Morgan Stanley alone, though. Co-presidents Andy Saperstein and Dan Simkowitz handle wealth and investment management, and integrated investment banking, respectively. That division of labor keeps both halves of the firm’s business moving under a single chief executive’s strategy.
Business Segments and Divisions
Morgan Stanley reports three business segments. The revenue split explains a lot about how the firm actually makes money. Wealth Management generated $31.8 billion in fiscal 2025, about 48.5% of net revenue. That’s by far the largest single piece. Institutional Securities covers investment banking plus equity and fixed-income trading. It brought in $33.1 billion, or roughly 42.6% of the total.
Investment Management, the smallest segment, added $6.5 billion, close to 9.9% of net revenue. Together, the three segments show a firm nearly split between advising wealthy individuals and executing institutional deals. Traditional and alternative asset management fills out the rest.
Financial Performance & Scale
Total Assets and Balance Sheet Size
Morgan Stanley’s balance sheet has grown quickly over the past few years. Total assets reached approximately $1.42 trillion by the end of 2025. That’s up from roughly $1.19 trillion in 2023 and about $1.18 trillion the year before. Record wealth-management inflows and larger trading balances drove most of that expansion.
Capital levels held up well despite the growth. The firm’s standardized common equity tier 1 ratio stood at 15.0% at year-end 2025, down slightly from 15.9% a year earlier. Its advanced-approach CET1 ratio, a stricter measure, came in higher at 16.1%.
Annual Revenue and Net Income
Fiscal 2025 set records across nearly every metric that matters. Morgan Stanley posted $70.6 billion in net revenue and $16.9 billion in net income for the full year. Diluted earnings landed at $10.21 per share. Return on tangible common equity hit 21.6%. The fourth quarter alone brought in $17.9 billion of revenue and $4.4 billion of profit.
That momentum didn’t slow in 2026. Second-quarter net revenue reached $21.3 billion, another record and a 27% jump from the same period in 2025. Net income climbed roughly 60% year over year, to $5.6 billion. Institutional Securities and Wealth Management both posted record quarterly revenue that period. Institutional Securities hit $11.0 billion; Wealth Management reached $8.9 billion, with a pre-tax margin of 30.5%.
Customer Count and Market Share
Morgan Stanley doesn’t disclose a traditional retail customer count the way a checking-account bank would. Instead, it tracks client assets, and that figure tells a clearer story about its footprint. Wealth Management alone held $9.3 trillion in client assets at the end of 2025. That’s up from about $5.4 trillion shortly after the Eaton Vance deal closed in 2021.
Fee-based client assets across Wealth and Investment Management combined reached $3.022 trillion as of the second quarter of 2026. Wealth Management also added $356 billion of net new assets over full-year 2025 alone. That’s evidence clients keep bringing new money to the platform, not just watching existing balances grow with the market.
Stock Performance and Credit Ratings
Morgan Stanley’s market capitalization sat at roughly $325 billion to $334 billion in early-to-mid September 2026. Shares traded somewhere near $207 to $213. The stock climbed about 38% over the trailing 12 months. It gained nearly 20% year-to-date through early September — a strong run even by Wall Street standards.
Credit rating agencies rate Morgan Stanley solidly investment-grade. Senior unsecured debt sits generally in the A-range across Moody’s, S&P, and Fitch. Exact current letter grades can shift with routine agency reviews. Readers evaluating the firm’s debt should check Morgan Stanley’s investor relations disclosures or a current bond-data source directly.
Products, Services & Specialties
Core Banking Products
Morgan Stanley is primarily an investment bank and wealth manager, not a traditional retail-deposit bank. That’s a distinction worth underscoring for readers used to thinking about banking basics — checking accounts, branch tellers, that sort of thing. Its E*TRADE acquisition did add direct-to-consumer brokerage, banking, and stock-plan accounts. But deposit-taking has never been the core of the business.
The firm’s main lines are investment banking, institutional sales and trading, wealth management, and asset management. Investment banking covers mergers-and-acquisitions advisory and underwriting. Institutional sales and trading spans equities and fixed income. Wealth management runs through both financial advisors and self-directed E*TRADE accounts, while asset management covers traditional and alternative strategies.
Specialty Divisions and Niche Strengths
The post-ETRADE Wealth Management division is arguably Morgan Stanley’s signature strength. It combines high-touch, advisor-led brokerage with ETRADE’s self-directed digital platform. That’s a rare setup: it serves both ultra-wealthy families and everyday DIY investors under one corporate roof. With $9.3 trillion in client assets, it’s likely the largest wealth platform among the traditional Wall Street banks.
Morgan Stanley at Work, the firm’s workplace financial-wellness and equity-compensation platform, administers stock plans through Shareworks and Equity Edge Online. It functions as a quiet funnel. Employees who first meet Morgan Stanley through a company stock plan often become wealth management clients later. The Institutional Securities division rounds things out with a top-tier global M&A advisory and equities franchise. It posted record results in 2026.
Digital Banking and Technology
E*TRADE remains a distinct, recognizable brand for direct-to-consumer digital brokerage and banking under the Morgan Stanley umbrella. On the corporate side, Shareworks and Equity Edge Online handle stock-plan administration for Morgan Stanley at Work clients.
CEO Ted Pick has made artificial intelligence a public talking point. He argues it could save financial advisors somewhere around 10 to 15 hours per week. AI could automate tasks like transcribing and categorizing client conversations. He’s also called AI-driven infrastructure financing “an enormous flywheel” for the investment bank. He points to utilities, data centers, and AI companies that all need capital. That thesis led to the August 2026 launch of the firm’s U.S. Innovation Infrastructure Initiative. It aims to facilitate roughly $1.5 trillion in related financing activity.
Fees, Rates, and Customer Experience
Morgan Stanley’s fee structures vary sharply by business line. Wealth Management leans on advisory fees tied to assets under management. That shift toward recurring fee revenue helped push the division’s pre-tax margin to 30.5% in the second quarter of 2026. E*TRADE, by contrast, still offers commission-free retail stock and ETF trades, standard across the industry.
Institutional clients pay differently altogether. Fees there run on deals, underwriting spreads, and assets under management rather than flat rates. There’s no single fee schedule that applies across the whole firm. Morgan Stanley isn’t really one business. It’s several, bundled under one name.
Reputation, Risks & Recent Developments
Regulatory History and Compliance Record
Morgan Stanley’s regulatory history includes some genuinely large settlements. In 2016, the firm agreed to pay $3.2 billion over mortgage-backed-securities misconduct tied to the 2008 financial crisis. That came on top of earlier settlements worth roughly $1.25 billion with federal housing regulators, for similar crisis-era mortgage practices.
More recently, in January 2024, Morgan Stanley agreed to pay $249 million total to resolve a multi-year criminal and SEC investigation. A former executive had allegedly leaked information to favored clients. The SEC separately charged the firm and that executive with fraud. Later that year, the SEC also charged Morgan Stanley Smith Barney over policy gaps. Those gaps failed to catch financial advisors stealing from investors.
Competitive Position and Differentiation
Morgan Stanley makes money differently than Chase, Bank of America, or Wells Fargo. Those banks lean heavily on net interest income from consumer deposits and loans. Morgan Stanley’s revenue instead comes primarily from wealth and asset management fees plus institutional securities activity. That structure behaves more like an asset manager crossed with a trading firm than a traditional bank.
Compared with peers, Goldman Sachs still skews harder toward trading and banking. Charles Schwab dominates mass-market self-directed brokerage instead. Morgan Stanley’s post-E*TRADE model uniquely spans both ends of that spectrum, from ultra-high-net-worth advisory down to DIY retail investing. That gives it a broader footprint than either rival covers alone.
Recent News and 2026 Developments
The second quarter of 2026 delivered record firm-wide revenue of $21.3 billion. Both Institutional Securities and Wealth Management set segment records in the same quarter. That performance came alongside the August 2026 launch of the U.S. Innovation Infrastructure Initiative. The initiative is tied to roughly $1.5 trillion in AI and data-center financing activity.
Morgan Stanley Real Estate Investing kept adding smaller principal deals through the same period, including seniors-housing and industrial properties. The board also reauthorized up to $20 billion in future share repurchases during the second quarter. That move signals confidence in the firm’s capital position, even as it keeps investing in growth.
Strengths, Weaknesses, and Who This Bank Suits
Morgan Stanley’s strengths are hard to argue with. Record wealth-management scale, diversified fee income, and a top-tier investment banking and trading franchise all stand out. So does its successfully integrated E*TRADE and Eaton Vance combination. Its capital-return program, backed by that $20 billion buyback authorization, adds another point in its favor.
The weaknesses cluster around concentration and conduct risk. Trading and advisory misconduct produced real settlements in 2024. The firm’s revenue is also more sensitive to capital-markets swings than a deposit-funded bank’s would be. It also, quite simply, isn’t a source of everyday transactional banking for most people.
That last point defines who actually belongs with this bank. Morgan Stanley suits high-net-worth and mass-affluent clients working with a financial advisor. It also suits self-directed investors using the E*TRADE brand, and corporations needing M&A or underwriting help. Employees whose companies use Morgan Stanley at Work for stock-plan benefits belong here too. It is not, and was never built to be, a place for everyday checking and savings. Wealth management and trading together keep Morgan Stanley solidly inside the largest banks in North America.
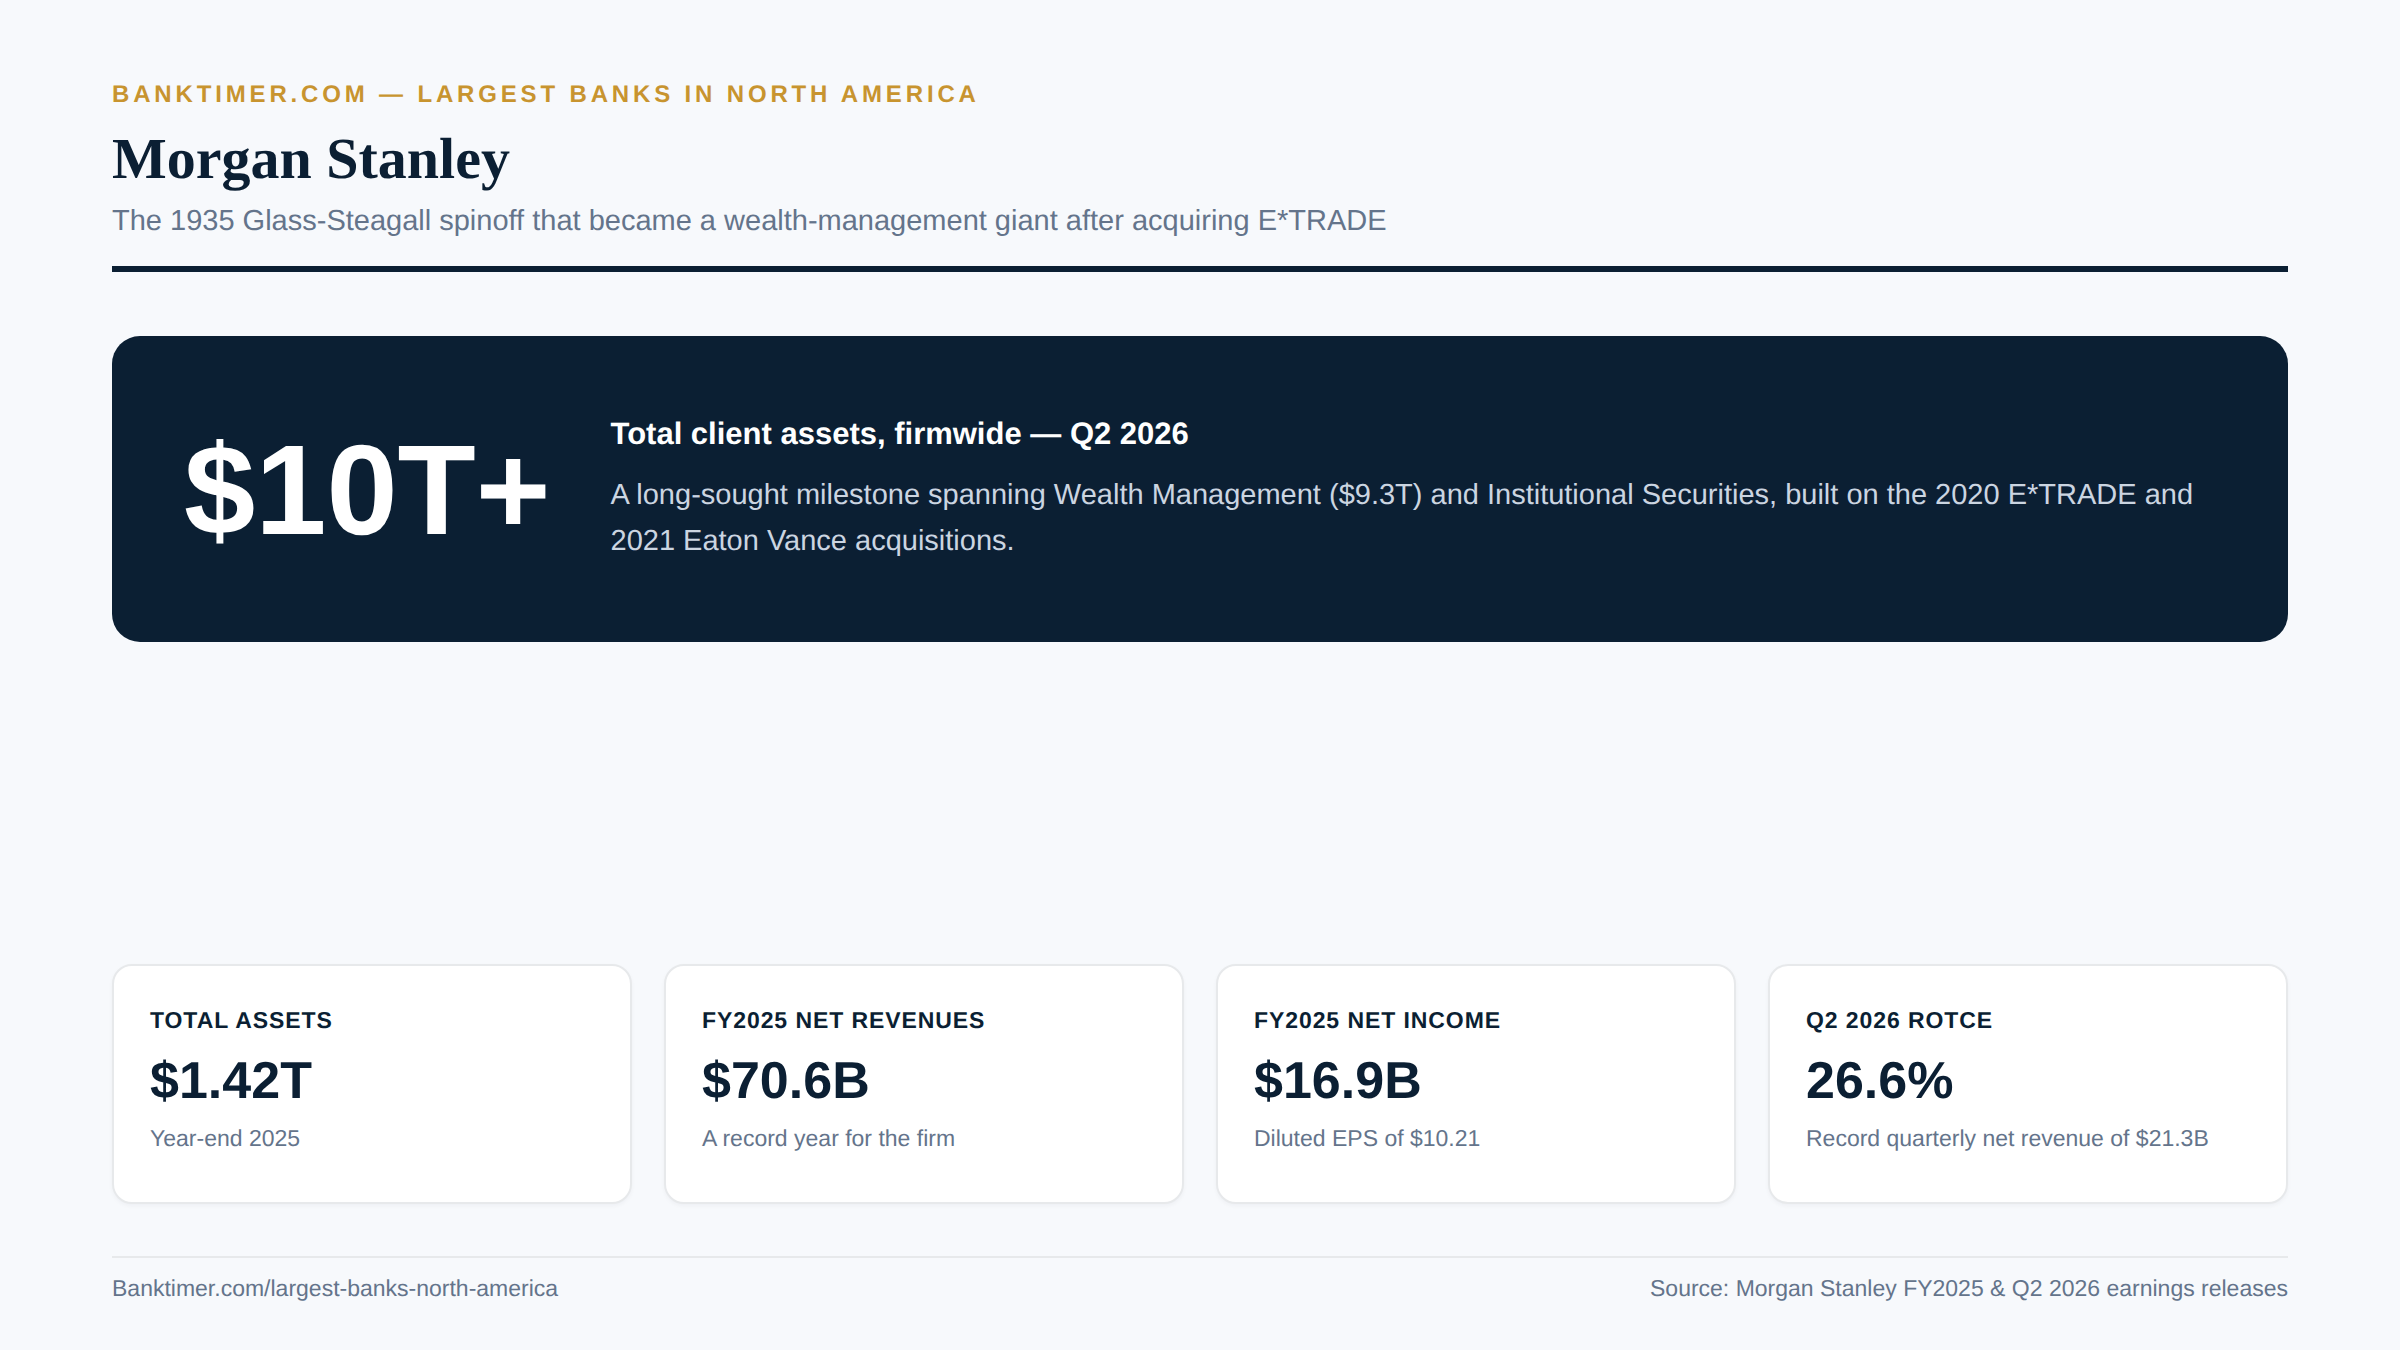
Morgan Stanley just crossed $10 trillion in client assets — here’s how it got there
State Street Corporation
State Street doesn’t run branches, and most Americans have never heard of it. Yet it quietly holds custody over more money than almost any institution on earth. The company traces its roots to Union Bank, chartered in Boston on June 25, 1792 by Massachusetts Governor John Hancock. That lineage makes State Street the second-oldest continuously operating bank in the United States. It took the “State Street” name in 1925, after Union Bank merged with National Union Bank. The company has run from One Congress Street in Boston ever since.
The figure that defines State Street’s place among the largest banks in North America is staggering by design. State Street held $53.8 trillion in assets under custody and administration as of December 31, 2025. That’s up 16% from a year earlier. The number dwarfs the company’s own balance sheet by roughly 145 times. It reflects money State Street safeguards and administers for others, not money it owns or lends.
State Street belongs on this list precisely because that scale exists almost entirely out of public view. It trades on the New York Stock Exchange as STT. Its principal subsidiary is State Street Bank and Trust Company. That subsidiary serves institutional clients — asset managers, pension funds, insurers, and sovereign wealth funds — rather than everyday depositors. Understanding State Street means understanding the plumbing behind the mutual funds and ETFs millions of people already own. Few of the largest banks in North America operate this far from the public eye while touching this much of the financial system.
Corporate Profile & History
Founding, Headquarters, and Corporate Structure
State Street’s 1792 charter as Union Bank predates most of the institutions on this list by well over a century. The “State Street” name arrived later, in October 1925, when Union Bank merged with National Union Bank. Headquarters have stayed in Boston, currently at One Congress Street.
The company is structured as a bank holding company. Its main operating arm, State Street Bank and Trust Company, is explicitly not a retail-deposit bank. It’s one of the world’s largest custodian and institutional-servicing banks instead. That role shapes literally every other fact about the company.
Major Mergers, Acquisitions, and Milestones
State Street’s growth has come largely through acquisitions of specialized capabilities rather than sprawling branch mergers. A 2007 purchase of Investors Financial Services Corp., worth roughly $4.5 billion, expanded its custody and fund-administration business substantially. In 2018, the company bought Charles River Development for about $2.6 billion. The deal added front-office investment-management technology used by asset managers worldwide.
Not every deal closed. State Street agreed in 2021 to acquire Brown Brothers Harriman’s Investor Services business, for roughly $3.5 billion. It abandoned the deal in November 2022 amid regulatory and integration concerns. More recent expansion has focused on geography instead. A 2025 agreement to acquire Mizuho Financial Group’s global custody business extends State Street’s reach into Asia. A separate 2025 tie-up referencing Santander CACEIS pushes further into Latin American securities services.
One rebrand deserves special mention. In June 2025, State Street Global Advisors became State Street Investment Management. SSGA had run the asset-management arm behind the SPDR ETF family. The rebrand dropped the “Global Advisors” name it had carried for roughly 35 years. It’s part of a broader “One State Street” branding push.
Leadership and Governance
Ronald P. O’Hanley has served as chairman and chief executive since succeeding Jay Hooley around 2018 or 2019. Before taking the top job, O’Hanley led State Street Global Advisors. That’s the asset-management division he’d go on to oversee at the group level. The combined chairman-and-CEO structure keeps strategic and governance authority under one executive.
O’Hanley also holds visible civic roles outside the company. He chairs the honorary board for Boston’s portion of the FIFA World Cup 2026. It’s a reminder that State Street, despite its low consumer profile, carries real institutional weight in its home city.
Business Segments and Divisions
State Street organizes its business into three segments. Global Services, the investment-servicing arm, handles custody, fund administration, and securities services for asset managers, asset owners, and insurers. This is the core custodian business that generates most of State Street’s scale.
State Street Investment Management, formerly SSGA, runs the asset-management side, anchored by the SPDR ETF franchise. Global Markets rounds out the portfolio with foreign exchange, securities finance and lending, and trading and research across equities, fixed income, and derivatives. These services layer on top of existing custody relationships, rather than getting sold cold to new clients.
Financial Performance & Scale
Total Assets and Balance Sheet Size
State Street’s own balance sheet looks almost modest next to its custody figures. Total assets stood at approximately $371.1 billion as of the third quarter of 2025, up about 9.6% year over year. Full-year 2024 assets had come in at $353.2 billion.
The real headline number, though, is assets under custody and administration: $53.8 trillion at the end of 2025. Assets under management, run mainly through State Street Investment Management and the SPDR platform, reached $5.665 trillion in the same period. That’s up 20% from $4.715 trillion the year before.
Annual Revenue and Net Income
Fourth-quarter 2025 revenue reached $3.667 billion, up 7% year over year. Net income came in at $747 million, with diluted earnings per share at $2.42. Excluding a one-time $226 million repositioning charge for workforce and real-estate rationalization, EPS was $2.97. Return on tangible common equity was 17.5% as reported, or 21.5% excluding that charge.
Trailing twelve-month revenue reached roughly $15.02 billion, up close to 13% from the prior year. Trailing net income came in around $3.22 billion, with trailing EPS near $11.33. Both figures rose more than 20% year over year. That trajectory follows a full 2024, in which State Street posted $13.00 billion in revenue and $2.687 billion in net income. The growth has been genuinely accelerating, not just a one-quarter blip.
Customer Count and Market Share
State Street doesn’t count retail customers because it essentially doesn’t have any in the conventional sense. Its clients are asset managers, pension funds, insurers, sovereign wealth funds, and official institutions around the world. It competes for their business on scale and technology, rather than branch convenience.
That $53.8 trillion in custody assets puts State Street among the top two or three custodians globally. Only BNY, at $59.3 trillion, ranks higher. Its $5.7 trillion in assets under management also makes State Street Investment Management one of the largest asset managers anywhere. Much of that comes from SPY and the rest of the SPDR ETF lineup. The company employs roughly 52,000 people worldwide.
Stock Performance and Credit Ratings
State Street’s market capitalization sat around $50 billion to $53 billion in late August and mid-September 2026. Shares traded somewhere between $182 and $193. The stock has been one of the strongest large-bank performers of the past year. It’s up roughly 57% to 68% over the trailing twelve months. The 52-week range spans about $104.64 to $195.93.
Credit ratings reflect a conservative, low-credit-risk profile typical of custodian banks. Moody’s rates the holding company Aa3, S&P rates it A, and Fitch rates it AA-, all with stable outlooks. The bank subsidiary, State Street Bank and Trust Company, carries even stronger ratings. Moody’s puts it at Aa2, S&P at AA-, and Fitch at AA+ on senior debt.
Products, Services & Specialties
Core Banking Products
State Street is not, in any meaningful sense, a retail-deposit bank. There’s no checking account or debit card a typical reader could open here. Its core business is institutional custody, fund administration, and securities services for asset managers, pension funds, sovereign wealth funds, insurers, and official institutions.
Specific services include global custody, fund accounting and administration, middle-office outsourcing, and securities lending. They also include foreign-exchange execution and front-to-back investment-management technology, delivered through Charles River Development.
Specialty Divisions and Niche Strengths
State Street Investment Management, rebranded from State Street Global Advisors in 2025, manages the SPDR ETF family. That family includes SPY, one of the largest and most heavily traded ETFs on earth. It’s also a genuine pioneer of the entire ETF industry, dating to its 1993 launch. Few asset managers can claim to have essentially invented a product category.
Charles River Development, acquired in 2018, supplies front-office investment-management software used by asset managers globally for order and portfolio management. The Global Markets division adds foreign exchange, securities finance, and trading and research on top of existing custody relationships. That gives State Street a value-add layer pure custodians can’t easily match.
Digital Banking and Technology
State Street has leaned hard into AI-driven efficiency, and the numbers show it. The company reportedly cut around 900 jobs in a single recent quarter, explicitly tied to AI adoption and cost discipline. That came alongside the $226 million fourth-quarter 2025 repositioning charge for workforce and real-estate rationalization.
At the same time, the company keeps investing in Charles River’s front-office platform. It’s also building digital custody and data-analytics tools for institutional clients. The strategy looks less like shrinking to survive and more like automating the back office to fund the front office.
Fees, Rates, and Customer Experience
Because State Street’s clients are institutions, its revenue model runs almost entirely on fees. Custody and servicing charges get measured in basis points against assets under custody. Asset-management fees run against AUM, leaning heavily toward low-cost index and ETF products. Foreign-exchange spreads and revenue-sharing from securities lending round out the model.
There’s no consumer-facing customer experience to speak of here, no branch network, and no app-store rating to check. Instead, State Street’s relationship model runs through dedicated client-service teams and deep technology integration. It’s a business built for institutions that measure success in basis points, not customer-satisfaction surveys.
Reputation, Risks & Recent Developments
Regulatory History and Compliance Record
State Street’s regulatory history includes some serious enforcement actions, mostly clustered in the mid-2010s. Between 2016 and 2017, the company paid a combined total in the range of $530 million to $560 million across Department of Justice and SEC actions. Those actions targeted a long-running foreign-exchange overcharging scheme. State Street had secretly marked up FX rates for custody clients over roughly a decade.
Separately, in 2017, State Street paid $64.6 million to resolve DOJ fraud charges over a secret-commission scheme. That scheme hit at least six custody clients over about six years. The same year brought a $5 million SEC settlement over CDO-related disclosure issues and a $5 million settlement of pay-discrimination claims. More recently, in 2025, the company drew criticism from 17 state attorneys general over disclosures related to China investment exposure. That’s a political and reputational matter, rather than a fine.
Competitive Position and Differentiation
State Street competes as one of the “Big Three” custodian banks, alongside BNY and JPMorgan, with Northern Trust as a smaller peer. It differentiates itself by combining custody and asset management under one roof. The SPDR franchise sits inside the same company that safeguards trillions in institutional assets. That pairing is one BNY’s more segmented structure doesn’t quite replicate.
Its separation from retail banking is total. State Street holds no consumer deposit franchise whatsoever and competes purely for institutional mandates. The 2025 rebrand to “State Street Investment Management” signals a deliberate push toward cross-selling. The goal: sell custody, markets, and asset management as one unified relationship, rather than three separate pitches.
Recent News and 2026 Developments
State Street’s most consequential recent moves cluster around three things. The June 2025 SSGA rebrand was one. Roughly 900 jobs cut in a single 2025 quarter, as part of an AI-driven efficiency push, was another. A pending Mizuho custody acquisition, expanding its Asia-Pacific footprint, was the third. A July 2026 announcement extended the company’s reach into Latin America through a tie-up referencing Santander CACEIS.
Second-quarter 2026 results, reported in mid-July, continued the pattern of record custody and asset-management growth. The stock has climbed somewhere between 57% and 68% over the trailing year. The recent narrative here is margin expansion, built on scale and cost discipline.
Strengths, Weaknesses, and Who This Bank Suits
State Street’s strengths start with sheer stickiness. A $53.8 trillion custody base generates durable, recurring fee revenue. That revenue doesn’t evaporate the way trading profits can. Its SPDR franchise is a genuine top-tier, high-margin asset-management business. Its credit ratings, solidly in the AA range for the bank subsidiary, reflect a much lower credit-risk profile than a lending-heavy bank carries.
The weaknesses matter too. The mid-2010s foreign-exchange and hidden-fee scandals damaged institutional trust in a business that runs entirely on trust. Revenue tracks capital-markets levels, since AUC/A and AUM values move with the markets themselves. Recent restructuring charges suggest real margin pressure, one automation alone may not fully solve.
None of this makes State Street a bank for ordinary readers. It serves institutional clients exclusively — asset managers, pension funds, insurers, official institutions, and sovereign wealth funds. They come here for custody, administration, or index and ETF management. The only realistic touchpoint for someone outside that world is indirect. Anyone holding an SPDR ETF like SPY already has a relationship with State Street, whether they realize it or not. Its custody role alone earns State Street a spot among the largest banks in North America, even with a comparatively small balance sheet.
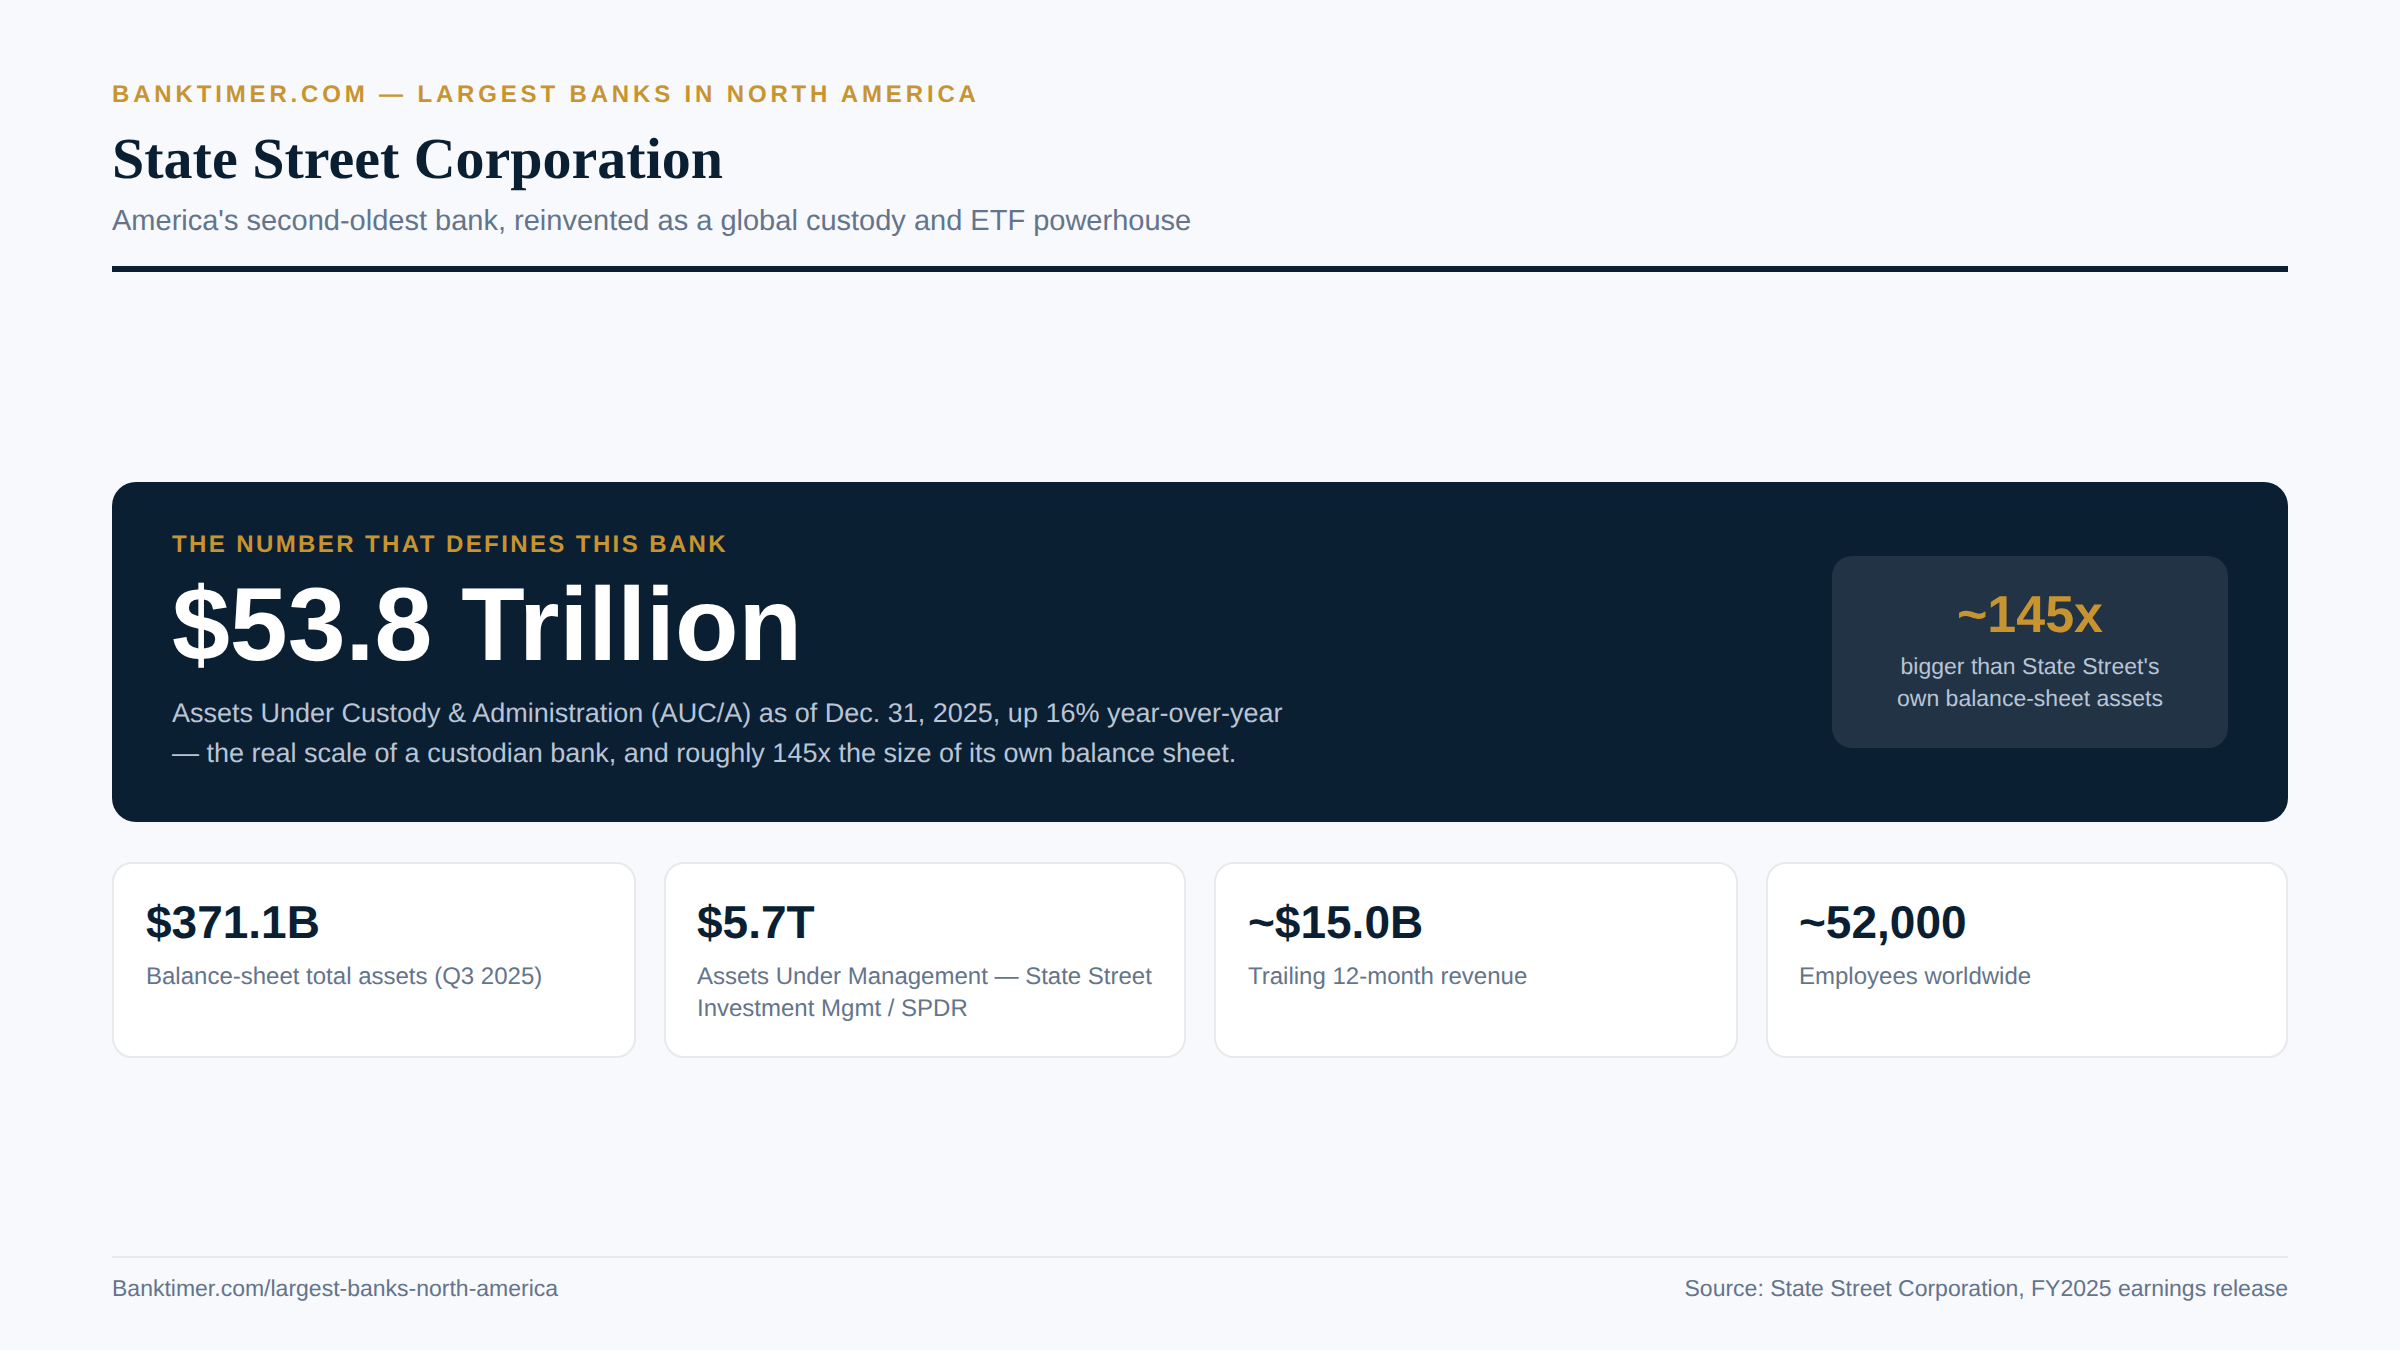
State Street’s real scale isn’t its balance sheet — it’s $53.8 trillion in assets it custodies for others
The Bank of New York Mellon (BNY)
BNY carries more institutional history than almost any bank in America. The Bank of New York side of the lineage dates to 1784. A group that included Alexander Hamilton founded it. That makes it one of the oldest banks still operating anywhere in the country. The Mellon side traces to 1870, when T. Mellon & Sons’ Bank opened in Pittsburgh. The two merged on July 1, 2007 to form The Bank of New York Mellon Corporation. In June 2024, the company simplified its public brand from “BNY Mellon” down to simply BNY. The legal entity name never changed, and neither did its ticker.
The figure that anchors BNY’s claim to this list is enormous. BNY held $59.3 trillion in assets under custody and administration as of December 31, 2025. That’s up 14% from the year before. That makes BNY the largest custodian bank in the world, edging out even State Street’s substantial $53.8 trillion. BNY is headquartered at 240 Greenwich Street in Manhattan and trades on the New York Stock Exchange as BK. It operates almost entirely behind the scenes of the financial system.
BNY belongs on this list for the same reason State Street does: scale that dwarfs public awareness. It safeguards assets for asset managers, broker-dealers, pension funds, and governments worldwide. Through its Pershing clearing platform, it also powers the back-office infrastructure for a huge share of the independent wealth-management industry. Very few everyday readers will ever open an account here directly, but plenty already touch BNY without knowing it. That scale of custody work is exactly why BNY counts among the largest banks in North America despite its low public profile.
Corporate Profile & History
Founding, Headquarters, and Corporate Structure
The Bank of New York’s 1784 founding counted Alexander Hamilton among its organizers. That makes it one of the oldest continuously operating financial institutions in the country. Mellon Financial Corporation traces back to Pittsburgh’s T. Mellon & Sons’ Bank in 1870. It brought a second century of institutional history into the eventual merger.
That merger closed July 1, 2007, creating The Bank of New York Mellon Corporation. At the time, it was the largest custodian bank in the world. Headquarters moved to 240 Greenwich Street in Manhattan in January 2018. The company operates as a bank holding and financial holding company. The Bank of New York Mellon is its core operating bank subsidiary.
Major Mergers, Acquisitions, and Milestones
The 2007 Bank of New York-Mellon merger stands as the defining event in the company’s modern history. It combined two centuries-old institutions into one of the largest financial-services combinations of its era. Nothing since has matched it in scale. The June 2024 rebrand to simply “BNY” did mark a meaningful modernization push under CEO Robin Vince. It dropped “Mellon” from the public-facing name, while keeping it in the legal entity title.
More recent milestones center on technology rather than deals. In December 2025, BNY announced a strategic collaboration with Google Cloud. The partnership advances its proprietary generative-AI platform, called Eliza, using Gemini Enterprise. The company has also pursued a multi-year partnership with OpenAI, as part of the same AI transformation strategy. And 2026 coverage describes an “Eliza 2.0” iteration pushing generative AI deeper into core financial operations.
Leadership and Governance
Robin Vince has served as chief executive since August 2022. A 2025 board decision also made him chairman, consolidating both roles under one leader. CFO Dermot McDonogh rounds out the top of the executive team.
The board named a lead independent director alongside that governance change. That’s a standard safeguard when one executive holds both the chairman and CEO titles. Readers researching BNY’s exact current board composition should check the company’s own governance disclosures. Board seats, after all, change more frequently than most other facts in a profile like this one.
Business Segments and Divisions
BNY organizes its business into three segments. Securities Services covers Asset Servicing and Issuer Services. It’s the core global custody business, and the source of most of the company’s headline scale. Market and Wealth Services includes Pershing, the clearing and custody platform for independent broker-dealers and registered investment advisors. It also covers payments, treasury services, and clearance.
Investment and Wealth Management, the third segment, includes BNY Investments (asset management) and BNY Wealth (private banking and family-office services for high-net-worth clients). Together, the three segments show a company built almost entirely around serving other financial institutions and wealthy individuals. The general public isn’t really part of the equation.
Financial Performance & Scale
Total Assets and Balance Sheet Size
BNY’s own balance sheet, like State Street’s, looks modest next to its custody numbers. Total assets reached approximately $472.3 billion at the end of 2025. That’s up from about $416 billion in 2024 and roughly $410 billion in 2023 — a clear acceleration after several flatter years. A trailing twelve-month figure through mid-2026 pushed that total to around $525 billion.
The custody figure is what really matters here. BNY held $59.3 trillion in assets under custody and administration as of December 31, 2025 — the largest of any custodian bank globally. BNY Investments also managed roughly $2.2 trillion in assets under management as of the same date.
Annual Revenue and Net Income
BNY reported $20.08 billion in total revenue, up 8% year over year. Net income landed somewhere between $5.3 billion and $5.6 billion, depending on whether preferred-dividend adjustments are included. Diluted earnings per share reached $7.40, or $7.50 adjusted, and return on tangible common equity hit 26.1%.
Fourth-quarter 2025 alone contributed $5.179 billion in revenue and $1.469 billion in net income. Both figures were up sharply from a year earlier. The company returned $5.0 billion to shareholders across 2025, through dividends and buybacks combined. It maintained a common equity tier 1 ratio of 11.9%, a comfortable cushion for an institution this size.
Customer Count and Market Share
Like State Street, BNY doesn’t serve retail depositors in any meaningful way. Its clients are asset managers, broker-dealers, corporations, governments, and insurers operating at institutional scale. The $59.3 trillion in custody assets is the largest of any custodian bank worldwide, ahead of State Street’s $53.8 trillion. BNY markets itself openly as the world’s largest custodian.
Pershing, BNY’s clearing and custody arm for independent broker-dealers and advisors, saw its revenue rise 9% in 2025. That’s a sign the independent wealth-management channel keeps growing, even as larger wirehouses consolidate.
Stock Performance and Credit Ratings
BNY’s market capitalization ranged from roughly $94 billion in May 2026 to close to $105 billion by mid-September 2026. Shares climbed from about $137 to nearly $155 over that stretch. The stock gained somewhere between 40% and 52% over the trailing twelve months, depending on the exact measurement window.
Credit ratings sit comfortably in investment-grade territory. The holding company carries Aa3 from Moody’s, A from S&P, and AA- from Fitch, all with stable outlooks. The bank subsidiary rates even higher — Aa1 from Moody’s and AA- from S&P on long-term deposits. Those ratings reflect a conservative, low-risk balance sheet, typical of custodian banks.
Products, Services & Specialties
Core Banking Products
BNY is not a retail-deposit bank in any conventional sense. There’s no everyday checking account to open here. It’s the world’s largest custodian bank. BNY provides global custody, fund administration, and issuer services — depositary receipts and corporate trust among them — to institutional clients exclusively.
Its three core lines mirror its segment structure. Securities Services covers custody and fund administration. Market and Wealth Services covers clearing through Pershing, plus payments and treasury. Investment and Wealth Management covers asset management and private wealth services for high-net-worth families.
Specialty Divisions and Niche Strengths
BNY Pershing stands out as one of the largest clearing and custody platforms in the country. It serves independent broker-dealers and registered investment advisors. It effectively runs the back office for a huge slice of the independent wealth-management industry. Its revenue climbed 9% in 2025 alone.
BNY Investments handles asset management, under the successor branding to the old “BNY Mellon Investment Management” name. BNY Wealth, meanwhile, delivers private banking and family-office services to high-net-worth and ultra-high-net-worth clients. BNY also carries a legacy specialty in depositary receipt issuance and administration. That service lets non-U.S. companies trade on American exchanges — a niche the original Bank of New York essentially pioneered.
Digital Banking and Technology
Eliza, BNY’s proprietary generative-AI platform, sits at the center of the company’s technology strategy. The December 2025 collaboration with Google Cloud brought Gemini Enterprise into the platform. A reported multi-year partnership with OpenAI adds another layer of AI capability. Coverage of an “Eliza 2.0” iteration in 2026 describes generative AI pushing deeper into core financial operations. Data processing, client servicing, and operational workflows are among the targets.
The stakes for getting this right are unusually high. BNY’s AI investments aim to improve efficiency across custody operations that process tens of trillions of dollars in client assets. Even small error rates compound into large absolute numbers at that scale.
Fees, Rates, and Customer Experience
BNY’s revenue model runs almost entirely on fees, much like State Street’s. Custody and servicing charges get measured against assets under custody, and asset-management fees against AUM. Clearing and platform fees through Pershing add another layer, alongside net interest income earned on client cash balances held in custody and clearing accounts.
BNY Wealth comes closest to a retail-facing offering, delivering private-banking-style, relationship-driven service. It’s exclusive to wealthy individuals and families, though, not the general public. Outside of that, there’s no mass-market retail banking presence, no consumer branch network, and no everyday checking or savings account to open.
Reputation, Risks & Recent Developments
Regulatory History and Compliance Record
BNY’s regulatory history includes some of the largest fines in the custodian-banking industry. In 2015, the company paid roughly $714 million combined across the Department of Justice, SEC, and state attorneys general. The payment settled a long-running foreign-exchange fraud scheme that overcharged custody clients. It ranks among the largest FX-related settlements of its kind, alongside a similar-era case against State Street.
That same year, BNY paid about $14 million to settle Foreign Corrupt Practices Act charges. The charges involved providing jobs and internships to relatives of sovereign wealth fund officials. Later enforcement included a 2017 SEC settlement over regulatory-capital miscalculations. A roughly $54 million settlement followed in 2018, over American Depositary Receipt handling violations. More recently, an August 2024 CFTC order fined BNY $5 million for swap-reporting and supervision failures. That last case is notable. The CFTC explicitly cited a violation of one of its own prior orders — a repeat-offense pattern worth watching.
Competitive Position and Differentiation
BNY holds the top spot among global custodians by assets under custody and administration. It sits narrowly ahead of State Street and larger than JPMorgan’s custody business. Together, the three form the “big three” of institutional asset servicing. Its key differentiator from State Street is diversification. Pershing gives BNY direct exposure to the independent broker-dealer and advisor ecosystem. BNY Wealth adds a private-banking arm State Street doesn’t really match. State Street, by contrast, leans harder into asset management through its SPDR franchise.
Like State Street, BNY holds essentially no consumer deposit franchise. That sets both firms sharply apart from universal retail banks such as JPMorgan, Bank of America, Wells Fargo, and Citi. All of them, notably, carry “systemically important” status.
Recent News and 2026 Developments
The December 2025 Google Cloud and Gemini Enterprise collaboration around Eliza stands as BNY’s most significant recent technology announcement. Continued build-out of its OpenAI partnership through 2026 followed close behind. On the governance side, Robin Vince’s 2025 consolidation of the chairman and CEO titles under one leader marked a notable structural shift.
On the capital-markets side, BNY priced a $500 million public offering of depositary shares in July 2026. It’s routine activity, but it still reflects active capital management. All of this sits against a backdrop of record fiscal 2025 results. Record revenue, record net income, and custody assets approaching $60 trillion all continue to headline coverage of the company into 2026.
Strengths, Weaknesses, and Who This Bank Suits
BNY’s core strength is simple to state: it’s the world’s largest custodian by assets under custody. Its institutional franchise spans custody, clearing through Pershing, asset management, and private wealth. Strong, investment-grade credit ratings reflect real balance-sheet conservatism. Its well-funded AI push, through Eliza, Google Cloud, and OpenAI, aims squarely at long-term efficiency gains.
The weaknesses deserve equal weight. BNY’s regulatory history includes significant enforcement — foreign-exchange overcharging, foreign-bribery violations, and ADR-handling failures among them. A 2024 CFTC fine was explicitly tied to violating a prior order, which raises real recidivism concerns for regulators to weigh going forward. Revenue also tracks capital-markets asset values, meaning results can swing with the broader market. Like all custodian banks, BNY has limited exposure to the net-interest-margin upside a lending-heavy bank enjoys.
This is not, and has never tried to be, a consumer bank. BNY serves institutional clients — asset managers, pension funds, insurers, and sovereign entities among them. It also serves independent broker-dealers and advisors through Pershing’s clearing platform. And it serves high-net-worth and ultra-high-net-worth families through BNY Wealth. An ordinary reader’s only realistic touchpoint is indirect. Their brokerage account might custody assets through BNY behind the scenes. Or a company they’ve invested in might rely on BNY-administered depositary receipts to trade on a U.S. exchange. As the world’s largest custodian, BNY belongs on any accurate list of the largest banks in North America.
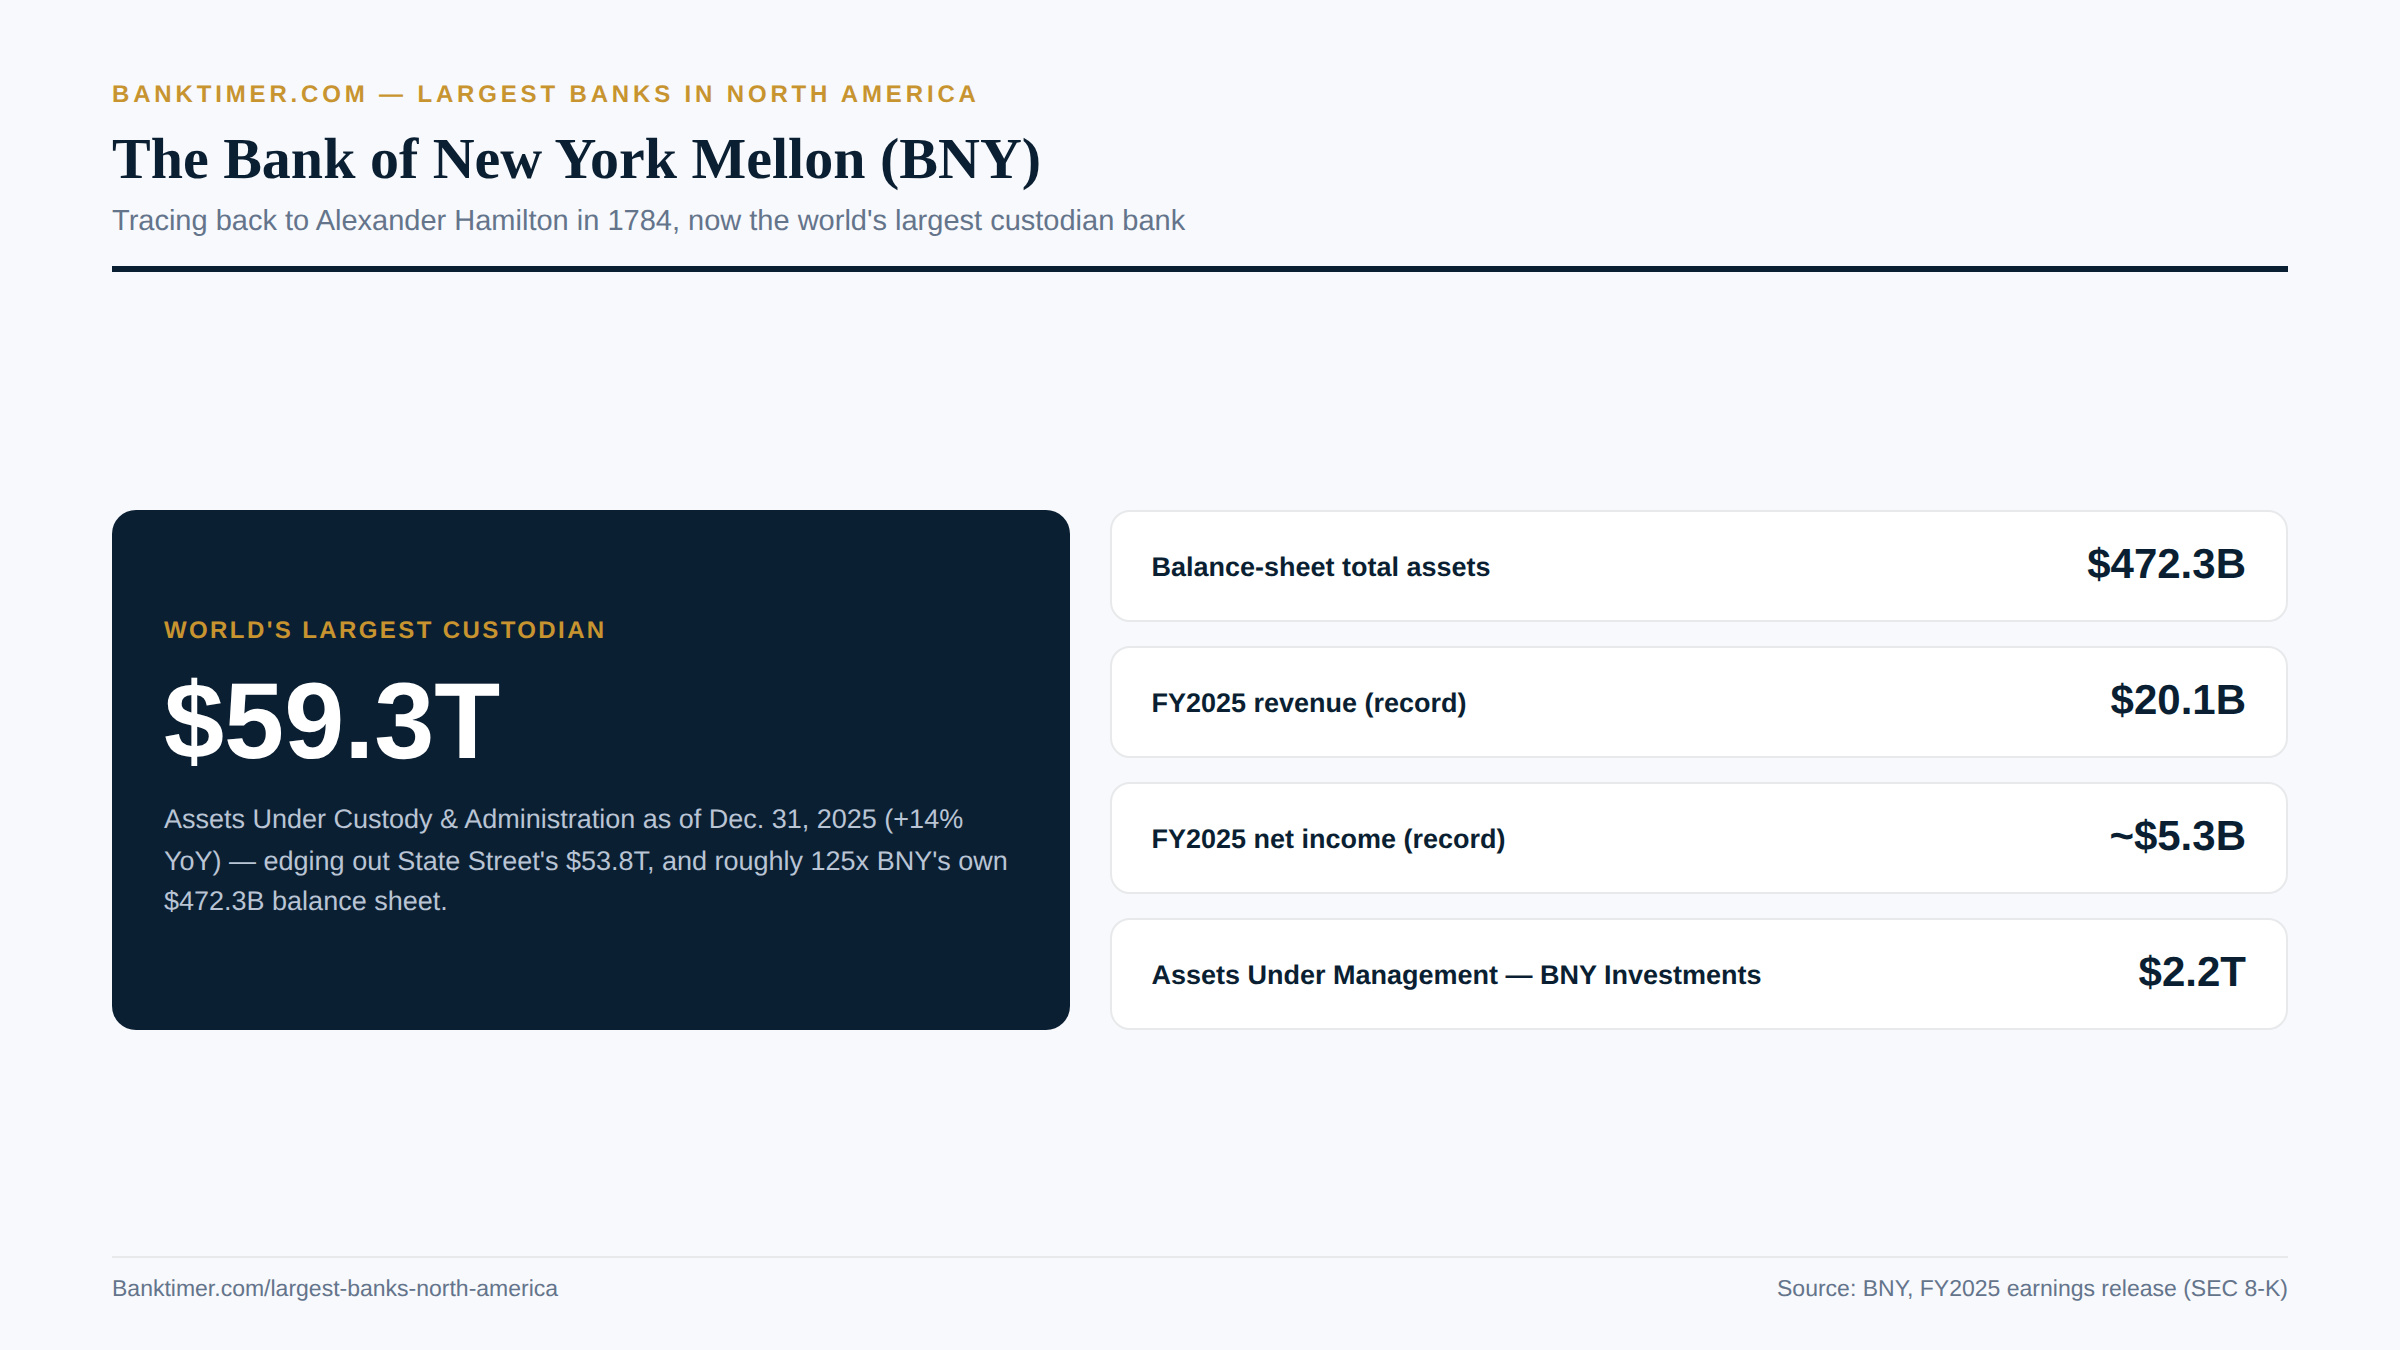
BNY custodies $59.3 trillion in client assets — more than any other bank on Earth
Charles Schwab
Charles Schwab built its name by tearing down the old brokerage fee model. That instinct still defines the company today. What started in 1971 as a scrappy discount broker has grown into one of North America’s largest financial institutions. It just doesn’t look like a typical bank. Schwab holds a bank charter, yes. But its real business is managing money for tens of millions of investors, advisors, and retirement savers.
The number that captures Schwab’s actual scale isn’t its balance sheet. It’s $11.9 trillion in total client assets as of year-end 2025. That figure dwarfs the deposit bases of most traditional banks on this list. The gap between brokerage scale and bank scale is the single most important thing to understand about Schwab.
Schwab earns its place here because it straddles two worlds at once: banking and investing. Few competitors blend them at this scale. The company runs a federally regulated bank subsidiary. It takes deposits and issues checking accounts. Yet its core identity remains brokerage and advice, not community banking. That dual role also means regulators watch Schwab through two different lenses at once, banking and securities. That dual identity is part of why Schwab shows up on lists of the largest banks in North America at all.
Corporate Profile & History
Founding, Headquarters, and Corporate Structure
Charles R. Schwab founded the company in 1971 as First Commander Corporation. He renamed it Charles Schwab & Co. two years later. Its roots stretch back further, to an investment newsletter Schwab launched in 1963. The firm built its early reputation on cutting costs for everyday investors, not catering to Wall Street insiders.
Schwab operated out of San Francisco for decades. It relocated headquarters to Westlake, Texas, effective January 1, 2021. Today the company operates as a savings and loan holding company under Federal Reserve oversight. It runs three separate depository institution subsidiaries for banking functions. As of December 2025, Schwab employed roughly 33,000 people across about 380 branches nationwide.
Major Mergers, Acquisitions, and Milestones
Schwab’s corporate history includes a strange loop. Bank of America bought the company in 1983 for $55 million. Charles Schwab himself bought it back in 1987, for $280 million. Later deals added scale, including the 2000 purchase of U.S. Trust for $2.73 billion, later sold back to Bank of America in 2007. OptionsXpress followed in 2011.
None of those compare to the deal that reshaped the company. The TD Ameritrade acquisition was a $22 billion all-stock transaction. Schwab announced it in late 2019 and closed it on October 6, 2020. Integration ran for years afterward. Client account conversions wrapped up in 2023. TD Ameritrade’s own trading platform, including the beloved thinkorswim software, shut down entirely in May 2024, with everything moving onto Schwab’s systems.
More recently, Schwab agreed in 2025 to acquire Forge Global for $660 million. The deal pushes Schwab into private-company share trading. It signals where the firm sees its next growth phase.
Leadership and Governance
Rick Wurster became CEO on January 1, 2025. He’d been named CEO-designate the previous October. Wurster already served as President and kept that title alongside the new role.
His predecessor, Walt Bettinger, ran the company for 16 years before retiring at the end of 2024. Under his watch, client assets grew from $1.14 trillion to $9.74 trillion. That’s an extraordinary run, one that set up the trillion-dollar milestones Schwab has since blown past. Bettinger now serves as Co-Chairman. Founder Charles Schwab remains active as board Chairman, still present more than five decades after starting the company.
Business Segments and Divisions
Schwab organizes itself into two primary segments. Investor Services covers individual retail investors and businesses. It spans brokerage, investment advisory, banking and trust services, plus Workplace Services for retirement and stock plan administration.
Advisor Services supports independent Registered Investment Advisors. It provides custody, trading, banking, trust, and practice-management tools. This segment grew substantially larger after the TD Ameritrade deal folded in TD’s own institutional custody business. That merger cemented Schwab’s position as the dominant custodian for independent RIAs. Investor Services also houses Mutual Fund Clearing Services, which handles back-office fund processing for other financial firms.
Financial Performance & Scale
Total Assets and Balance Sheet Size
Here’s where Schwab’s dual identity becomes concrete. Its bank balance sheet totaled $491.0 billion as of Q4 2025, up a modest 2% year-over-year. Now compare that to total client assets of $11.90 trillion, up 18% over the same period. Two very different growth stories live inside one company.
Client money kept flowing in throughout 2025. Core net new assets reached $519.4 billion for the full year. That’s a 5.1% organic growth rate. Q4 2025 alone contributed $163.9 billion. That kind of net inflow separates a thriving brokerage from a stagnant one.
Annual Revenue and Net Income
Schwab posted full-year 2025 revenue of $23.9 billion, up 22% year-over-year. Net income reached $8.9 billion, up 49%. Those aren’t incremental gains. They reflect a business firing on every cylinder at once: trading activity, net interest income, and advisory fees all moving in the same direction.
Q4 2025 alone brought in $6.3 billion in revenue, up 19% year-over-year. Net income hit $2.5 billion, up 34%. Adjusted diluted EPS reached $1.39, up 38%. Momentum carried through the year rather than concentrating in one quarter.
Customer Count and Market Share
Schwab ended 2025 with 38.5 million active brokerage accounts, up 6% year-over-year. Total client accounts reached 46.5 million across all product types. New account openings exceeded 1 million for five straight quarters. Q4 2025 alone added 1.3 million.
That growth has made Schwab the largest publicly traded discount brokerage and custodian in the United States by client assets. The TD Ameritrade acquisition locked in that position for the foreseeable future. That scale also gives Schwab considerable weight in U.S. retail trading volumes overall.
Stock Performance and Credit Ratings
Schwab shares closed at $105.16 on September 16, 2026. That gives the company a market capitalization of roughly $181.9 billion. The 52-week range ran from $83.96 to $114.53. Investors have rewarded this business steadily, not chased it in bursts.
Credit agencies rate Schwab solidly investment-grade, though not top-tier. S&P rates the company A-, stable outlook, having downgraded it from A in April 2023 over interest-rate risk. Moody’s assigns A2. Fitch rates it A, also stable.
Products, Services & Specialties
Core Banking Products
Schwab’s signature retail product breaks the traditional banking mold. The Schwab Bank High Yield Investor Checking account carries no monthly fees. It requires no minimum balance. It offers unlimited ATM fee rebates anywhere in the world. The catch, if you can call it that: it’s designed to pair with a linked Schwab brokerage account, not stand alone.
Beyond checking, Schwab offers investor savings accounts, CDs, and margin lending secured against brokerage holdings. Mortgages come through a Rocket Mortgage partnership rather than in-house origination at scale. Households weighing how to structure a linked account might first review the basics of a joint bank account before adding a second name. Three separate depository subsidiaries handle the actual deposit-taking and lending behind the scenes.
Specialty Divisions and Niche Strengths
Advisor Services stands out as Schwab’s most defensible niche. The firm is the largest custodian for independent RIAs in the country. That lead widened considerably once TD Ameritrade’s institutional custody clients merged in.
Workplace Services adds another specialty layer, handling equity compensation administration and 401(k) recordkeeping for employers. The 2025 Forge Global deal opens a further niche: private-market share trading for wealthy and institutional clients seeking liquidity in pre-IPO companies. Schwab Charitable rounds out the lineup with donor-advised fund administration.
Digital Banking and Technology
The thinkorswim platform, inherited from TD Ameritrade, survived the merger and thrived. TD Ameritrade’s own platform shut down in May 2024. Thinkorswim’s functionality moved fully onto Schwab’s technology stack, where it remains the flagship tool for active traders.
That technology investment shows up in customer satisfaction data. Charles Schwab Bank ranked #1 in the J.D. Power 2026 U.S. Direct Banking Satisfaction Study among direct-bank checking providers. That’s eight consecutive years at the top. The 2025 edition of the same study ranked Schwab #1 in both checking and savings at once.
Fees, Rates, and Customer Experience
Schwab helped trigger the industry’s shift to zero-commission online stock and ETF trading back in 2019. The move pressured competitors and ultimately pushed rivals like E*Trade and TD Ameritrade toward being acquired. That legacy still anchors Schwab’s pricing model today.
The high-yield checking account works almost like a loss-leader. It keeps client cash and brokerage assets under one roof rather than scattered across institutions. Competitors have struggled to match the combination of zero fees, no minimums, and worldwide ATM rebates in a single checking product. The repeated J.D. Power wins give Schwab a genuine, verifiable proof point on customer experience. A 2022 SEC action, detailed below, complicates that picture somewhat on fee transparency.
Reputation, Risks & Recent Developments
Regulatory History and Compliance Record
Schwab’s most significant recent regulatory event came in 2022. The SEC fined Schwab subsidiaries $187 million. The charge: failing to disclose that its robo-advisor, Schwab Intelligent Portfolios, swept client cash into affiliated bank accounts and loaned it out for profit rather than investing it. That practice created a cash drag on client returns between 2015 and 2018.
Older history includes a $10 million Bank Secrecy Act fine against the U.S. Trust subsidiary in 2001. A $200,000 NASD penalty followed in 1997 for failing to seek best execution. During the 2008 financial crisis, Schwab’s YieldPlus bond fund lost 31.7% of its value. That triggered roughly $1.1 billion in investor losses and related litigation. More recently, Schwab is among several major brokerages named in an ongoing wave of private class-action lawsuits over cash-sweep interest rates. Its specific exposure in that litigation remains unclear as of this writing.
Competitive Position and Differentiation
Schwab’s identity diverges sharply from a traditional regional bank. It operates brokerage-first, bank-second. Its bank charter exists largely to support cash management and securities-backed lending, not to chase community banking relationships. That $491 billion balance sheet next to $11.9 trillion in client assets is a ratio no pure regional bank comes close to matching.
Since absorbing TD Ameritrade, Schwab has no true peer among independent discount brokers. Its real competition comes from privately held Fidelity and, in wealth management, firms like Morgan Stanley and Merrill. Its zero-fee, high-yield checking model quietly undercuts fee structures at conventional banks for customers who want investing and banking together.
Recent News and 2026 Developments
The leadership transition to Rick Wurster is now complete. Bettinger has settled into his Co-Chairman role. Founder Charles Schwab remains active as Chairman. The Forge Global acquisition, agreed in 2025, continues moving Schwab further into private markets.
January 2026 brought record full-year 2025 results: record revenue, record net income, and record client assets of $11.9 trillion. Industry-wide cash-sweep litigation remains a live issue heading through 2026, one worth watching even without a disclosed settlement figure.
Strengths, Weaknesses, and Who This Bank Suits
Schwab’s strengths are considerable. It has massive scale in client assets, a genuine zero-commission pioneer legacy, and eight straight years atop J.D. Power’s direct-bank checking rankings. Its RIA custody franchise is unmatched. Brand loyalty among self-directed investors runs deep.
The weaknesses trace back to that same brokerage-first structure. Its balance sheet carries more interest-rate exposure than a typical bank, a factor behind the 2023 S&P downgrade. Cash-sweep practices remain a recurring regulatory theme. It also isn’t built for traditional full-service banking, with a limited branch network and no broad small-business lending suite.
Schwab suits self-directed investors well. It also fits buy-and-hold savers who want brokerage and banking under one login, independent advisors working through Advisor Services, and active traders relying on thinkorswim. It’s a weaker fit for anyone wanting a conventional community bank relationship, with mortgages, business loans, and dense branch access. Its brokerage scale, more than its bank charter, is why Schwab appears among the largest banks in North America.
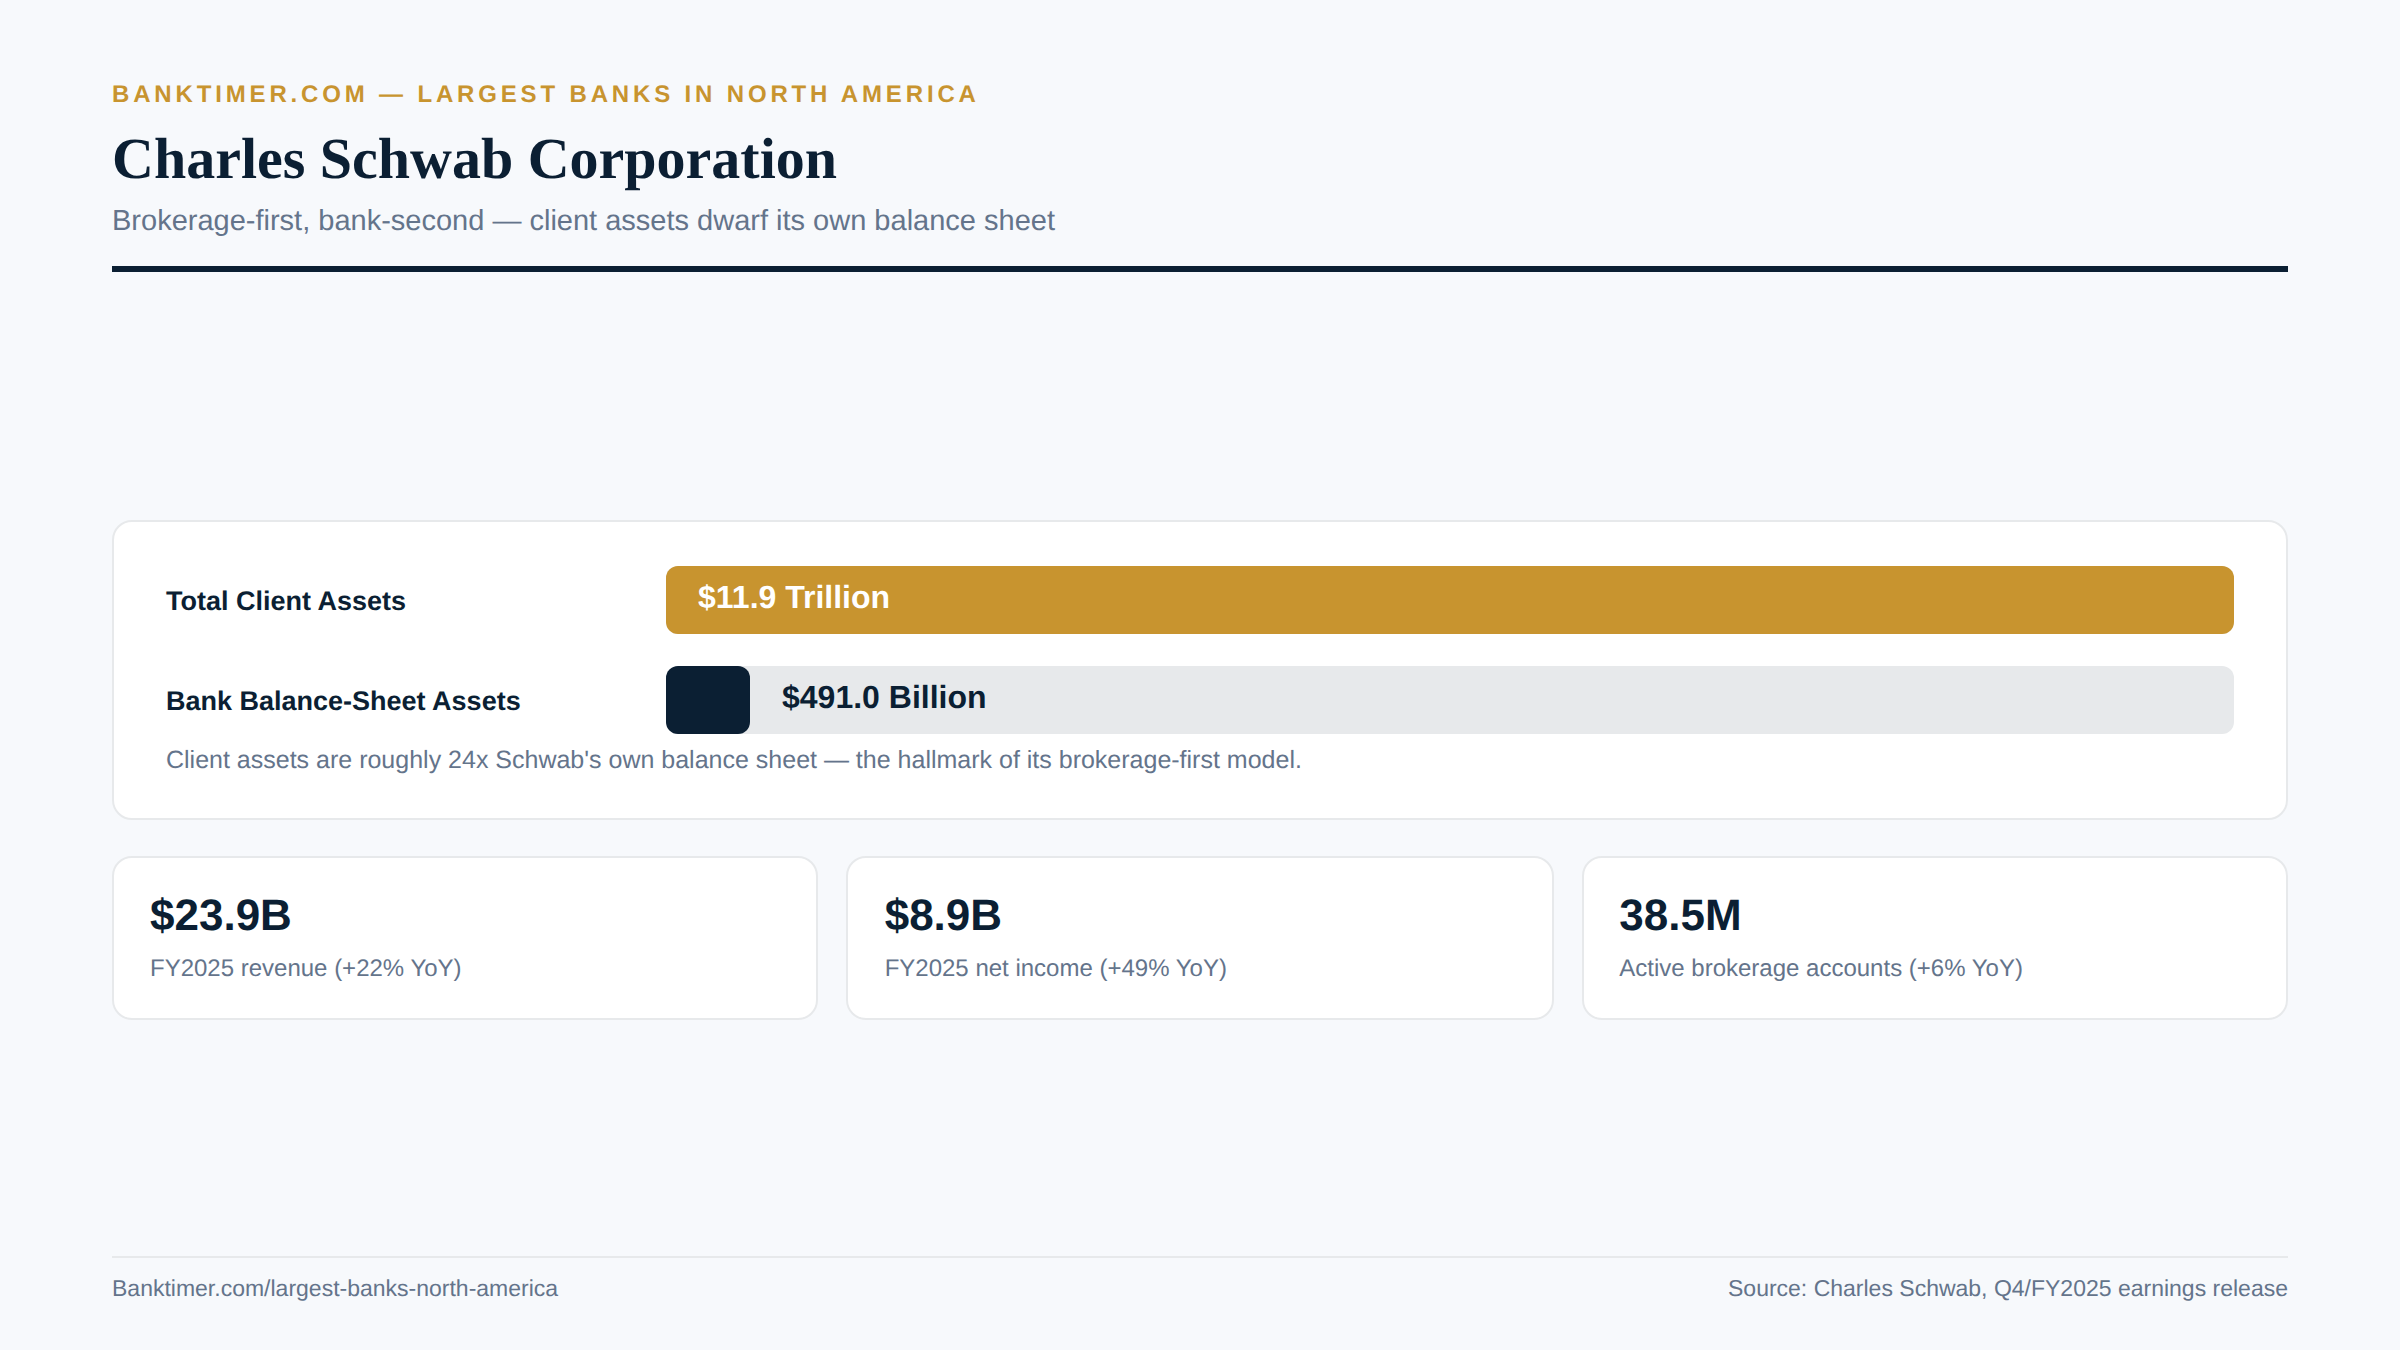
$11.9 trillion in client assets, just $491 billion on the balance sheet — that’s Schwab’s whole model
Fifth Third Bancorp
Fifth Third Bancorp spent over 150 years as a solid, if unglamorous, Midwest regional bank. Then, in early 2026, it did something that instantly changed its national profile. It closed a nearly $11 billion acquisition that pushed it into the ranks of America’s largest banks almost overnight.
The number that tells this story best is $300.1 billion in total assets as of Q2 2026, up 43% year-over-year. That jump didn’t come from years of slow organic growth. It came from one transformative deal, the Comerica acquisition, that reshaped Fifth Third’s footprint, balance sheet, and regulatory status within a single quarter.
Fifth Third belongs on this list because that acquisition turned a respected regional player into a genuine super-regional bank. Its reach now stretches from the Midwest to Texas and the Southeast. Few banks have changed size this dramatically this fast. The Comerica deal alone pushed Fifth Third several rungs higher among the largest banks in North America.
Corporate Profile & History
Founding, Headquarters, and Corporate Structure
Fifth Third traces its lineage to June 17, 1858, when the Bank of the Ohio Valley opened in Cincinnati. The distinctive name arrived in 1908, when Third National Bank merged with Fifth National Bank. Reportedly, the founders chose “Fifth Third” over “Third Fifth” to avoid an unfortunate Prohibition-era association.
The company remains headquartered at Fifth Third Center in Cincinnati, Ohio. It trades as a publicly held bank holding company. In June 2026, Fifth Third moved its stock listing from Nasdaq to the NYSE, keeping its familiar FITB ticker. Employee headcount tells its own story about the Comerica deal’s scale. Fifth Third had 18,676 employees at the end of 2025. That number jumped to 25,980 by Q1 2026 once the merger closed.
Major Mergers, Acquisitions, and Milestones
Before Comerica, Fifth Third’s biggest recent deal was the $4.7 billion MB Financial acquisition, completed in May 2018 to expand its Chicago presence. That deal later drew a shareholder class action, settled for $5.5 million in 2023 over cross-selling valuation allegations. Smaller acquisitions followed, including Dividend Finance in 2022 and Rize Money in 2023.
None of that prepared observers for the Comerica acquisition. This $10.9 billion all-stock deal stands as the defining event in Fifth Third’s recent history. Shareholders of both companies approved the merger in January 2026. Regulators cleared it soon after. The deal closed on February 1–2, 2026, under four months from announcement. Reporting attributed that unusually fast timeline to lighter regulatory scrutiny at the time.
The combination created a bank with roughly $294 billion in combined assets at close. That instantly made Fifth Third what the company itself described as the ninth-largest U.S. bank. Activist investor HoldCo Asset Management sued to block the deal. A judge dismissed those claims shortly before closing. Fifth Third targeted $850 million in annual cost savings. It moved its customer systems conversion up to Labor Day 2026, calling it the final step toward those synergies. The bank also laid out plans to reach roughly 1,750 branches by 2030, weighted toward the Southeast, Texas, Arizona, and California, backed by a $600 million investment in 150 new Texas locations.
Leadership and Governance
Timothy N. Spence holds the combined titles of Chairman, President, and CEO. That’s a unified leadership structure, not a split chair-and-CEO arrangement. Spence has led the company through its most consequential deal in decades. He steered both the Comerica negotiation and its unusually rapid close.
Business Segments and Divisions
Fifth Third operates across consumer banking, corporate and commercial banking, private banking, investment banking, insurance, mortgage lending, wealth management, and credit cards. Readers comparing card products across banks may find it useful to review credit card basics before weighing any issuer’s specific terms.
Post-Comerica, the bank layers Comerica’s respected middle-market commercial franchise onto its own retail-heavy Midwest and Southeast footprint. That franchise is particularly strong in Texas and Michigan. The combination diversifies Fifth Third’s business mix well beyond its historical consumer-banking core. Insurance products, sold alongside lending and deposit accounts, add a further cross-sell layer to the retail relationship.
Financial Performance & Scale
Total Assets and Balance Sheet Size
Fifth Third’s asset growth in 2026 reads almost like a step function. Assets stood at $262.9 billion at Q1 2026, immediately after the Comerica close, up 35% year-over-year. By Q2 2026, that figure reached $300.1 billion, up 43% year-over-year. The bank crossed a regulatory threshold that matters enormously (see Competitive Position below).
Deposits followed a similar path, reaching $234.1 billion at Q2 2026, up 43% year-over-year. Consumer deposits alone grew $4.6 billion in the quarter. A targeted retail deposit campaign in newly acquired Comerica markets helped drive that gain.
Annual Revenue and Net Income
The earnings story here has two very different chapters. Q1 2026 net income came in at just $165 million, down 68% year-over-year. Merger-related charges weighed it down: $510 million after-tax, tied to the Comerica deal. Adjusted for those one-time costs, EPS was $0.83 rather than the reported $0.15.
Q2 2026 told a far stronger story. Net income hit $801 million, up 28% year-over-year, on revenue of $3.279 billion, up 46%. Net interest margin expanded. Tangible book value per share grew despite the size of the deal, a sign the acquisition avoided the dilution common in merger-of-equals transactions.
Customer Count and Market Share
Fifth Third’s branch network expanded just as dramatically as its balance sheet. Banking centers reached 1,500 by Q2 2026, up 38% year-over-year, and up from 1,130 at the end of 2025. ATM count climbed past 2,643 in the same window, up from roughly 2,400 before the merger.
With $234.1 billion in deposits, Fifth Third now ranks among the top ten U.S. bank holding companies by deposit base. It hadn’t occupied that tier before the Comerica deal closed. That deposit growth also reflects Fifth Third’s broader retail footprint following the Comerica branch additions across new states.
Stock Performance and Credit Ratings
Fifth Third shares closed at $52.41 on September 16, 2026. Market capitalization sits at roughly $47.5 billion. Shares traded between $40.05 and $59.50 over the preceding 52 weeks. That range reflects investor uncertainty about integration risk, balanced against the deal’s long-term upside.
Credit ratings sit a notch below top-tier investment grade at the holding-company level. Moody’s rates Fifth Third Bancorp Baa1, negative outlook. S&P and Fitch both assign BBB+, stable outlooks. At the operating bank level, ratings run stronger: A3 from Moody’s, A- from S&P, A- from Fitch. That gap reflects the bank subsidiary’s cleaner risk profile relative to the holding company.
Products, Services & Specialties
Core Banking Products
Fifth Third offers the full consumer suite: checking, savings, CDs, credit cards, personal and auto loans, and mortgages. On the commercial side, it provides treasury management, commercial lending, leasing, and capital markets services. Comerica’s commercial lending capabilities now substantially strengthen that lineup.
Wealth management and private banking round out the offering for higher-net-worth clients. The bank has continued building this segment even while managing the Comerica integration.
Specialty Divisions and Niche Strengths
Dividend Finance, acquired in 2022, gives Fifth Third a fintech-adjacent specialty in point-of-sale solar and home-improvement lending. It’s a niche most traditional regional banks don’t touch directly.
The bigger specialty shift comes from Comerica. Fifth Third now inherits Comerica’s strength in middle-market commercial and industrial lending, along with an established franchise across Texas and Michigan. Evaluating a business borrower through that lending pipeline depends heavily on a sound credit underwriting process. Fifth Third’s expanded commercial book makes that discipline more central to its business than ever. Insurance and equipment leasing products fill out the remaining specialty set.
Digital Banking and Technology
Fifth Third’s mobile app earned genuine third-party recognition. J.D. Power named it the best mobile banking app experience in a 2025 survey. That’s a meaningful win in a category where digital experience increasingly drives customer retention. The bank has continued investing in features like budgeting tools and real-time alerts to keep that recognition intact.
Much of the bank’s current technology effort centers on the Comerica systems conversion, moved up to Labor Day 2026. The goal: unify digital banking platforms across the combined customer base as quickly as possible.
Fees, Rates, and Customer Experience
Fifth Third’s fee and customer-experience reputation carries real scars from past regulatory findings, detailed further below. Its forced auto-insurance and unauthorized-account practices were resolved through a 2024 consent order. Still, they shape how some customers and observers view its sales culture.
On the product side, standard fee structures apply across checking, savings, and lending lines. The bank doesn’t chase the aggressive discount positioning Schwab offers through its brokerage-linked checking account.
Reputation, Risks & Recent Developments
Regulatory History and Compliance Record
Fifth Third’s regulatory record includes a genuinely serious recent episode. In July 2024, the CFPB issued a $20 million consent order. It split into $5 million for illegal auto-lending practices and $15 million for opening unauthorized customer accounts. Investigators found that between 2011 and 2020, the bank forced unnecessary vehicle insurance onto borrowers. That caused more than $12.7 million in improper charges and roughly 1,000 wrongful vehicle repossessions. Separately, employees created fake accounts under an internal cross-selling incentive program. The order required redress to about 35,000 harmed consumers.
Earlier cases include an $18 million settlement in 2015 over discriminatory indirect auto-loan pricing. A $50 million telemarketing settlement was finalized in 2022. The 2018 MB Financial deal also generated a $5.5 million shareholder settlement in 2023. A 2024 Minnesota lawsuit alleged hidden fees within the Dividend Finance solar-lending subsidiary.
Competitive Position and Differentiation
Fifth Third’s core differentiator is geographic. It has a strong Midwest retail base across Ohio, Michigan, Illinois, Indiana, and Kentucky. Now it’s combined with Comerica’s high-quality commercial franchise in Texas and Michigan. That combination pushes Fifth Third toward genuine super-regional status, not just a Midwest identity.
Crossing $300 billion in assets carries real regulatory weight. It formally moves Fifth Third into Category III institution status. That subjects it to materially heavier prudential standards, including enhanced stress testing and liquidity requirements, than it faced as a smaller regional bank. This is a genuine strategic inflection point, not just a headline number.
Recent News and 2026 Developments
The Comerica merger closing on February 1–2, 2026 remains the single biggest event in Fifth Third’s recent history. Its effects are still working through the bank’s operations. The stock listing move from Nasdaq to NYSE in June 2026 added a further visibility boost. Analysts expect further updates on synergy realization as the bank reports subsequent 2026 quarters.
Integration hasn’t been friction-free. A WARN notice disclosed 184 job cuts at Comerica’s former Frisco, Texas site, effective March 13, 2026. Further headcount adjustments seem likely as consolidation continues through the year. HoldCo Asset Management’s lawsuit to block the merger was dismissed shortly before close, removing one source of deal uncertainty.
Strengths, Weaknesses, and Who This Bank Suits
Fifth Third’s strengths now include genuine top-ten scale by deposits and a durable Midwest retail franchise. Its mobile app has won industry awards. The commercial banking book is newly diversified across multiple growth regions. Tangible book value per share actually grew through the acquisition, evidence of disciplined deal execution rather than a value-destroying scramble for size. Investors have generally rewarded that execution so far, even as the stock’s wide 52-week range shows some lingering uncertainty.
The weaknesses are real, too. The 2024 CFPB order over fake accounts and forced insurance raises legitimate sales-practice governance questions. Short-term earnings volatility during integration reflects the sheer difficulty of digesting a nearly $300 billion combined institution in under a year. Heavier compliance obligations under Category III status add ongoing cost.
Fifth Third suits middle-market and small-business commercial clients well, especially in the Midwest, Texas, and Michigan. It also fits retail customers who value a strong mobile banking experience. It’s a weaker match for customers highly sensitive to sales-practice risk, or those wanting a bank with a long, settled post-merger track record, since integration work continues. Post-merger, Fifth Third’s balance sheet places it squarely among the largest banks in North America.
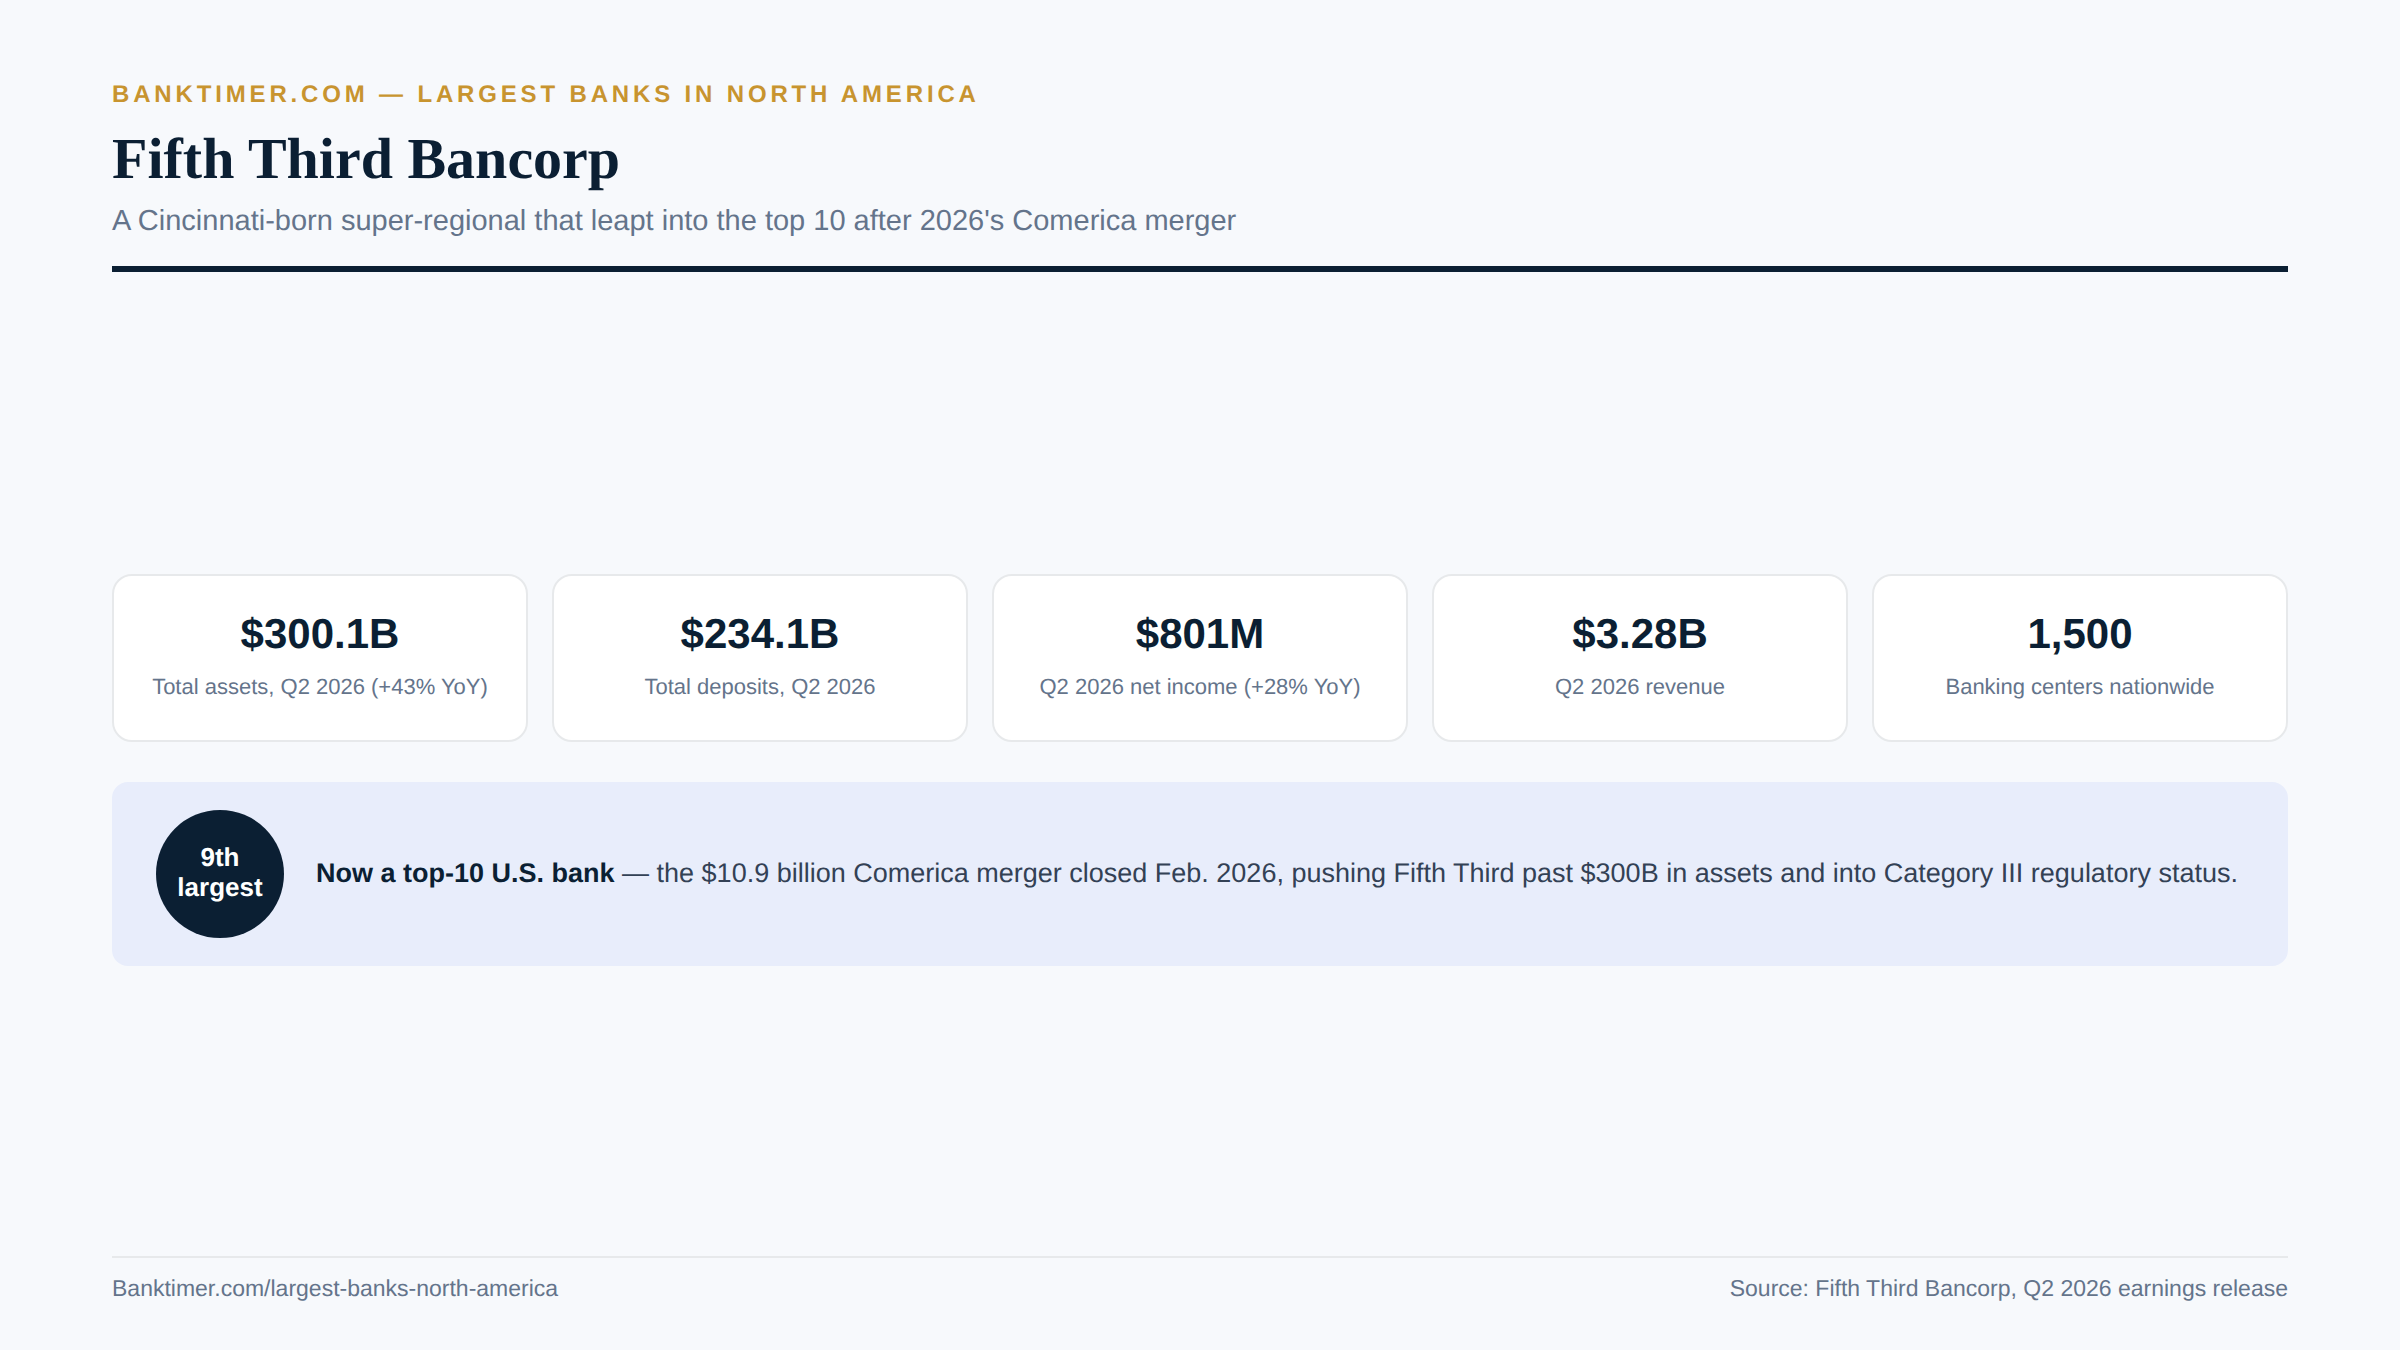
One $10.9B merger later, Fifth Third is officially a top-10 U.S. bank
Citizens Financial Group
Citizens Financial Group carries a lineage most American banks can’t match. It traces back to 1828, making it one of the oldest continuously operating financial institutions in the country. For most of that history, it operated in the shadow of foreign ownership. Only in the last decade has it stood on its own as an independent, publicly traded company.
The figure that best frames Citizens today is $233.8 billion in total assets as of Q2 2026, up 7% year-over-year. That’s steady, unspectacular growth, built without a single transformative mega-merger. It’s a sharp contrast to peers like Fifth Third, which doubled down on one blockbuster acquisition.
Citizens earns its spot on this list for three reasons: dense Northeast and Mid-Atlantic market presence, a genuinely differentiated private-banking push, and a 2026 controversy over prison financing that tested its reputation more than any peer bank faced this year. Even at a more modest scale than its money-center peers, Citizens has earned a place among the largest banks in North America.
Corporate Profile & History
Founding, Headquarters, and Corporate Structure
Citizens began in 1828 as the High Street Bank in Providence, Rhode Island. It later became Citizens Savings Bank in 1871. The company adopted its current name, Citizens Financial Group, after acquiring The Greenville Trust Company in 1954.
The company’s modern history took a foreign turn in 1988. The Royal Bank of Scotland acquired Citizens, and that ownership lasted over two decades. RBS fully exited following Citizens’ IPO on September 24, 2014, which raised $3 billion and stood as the largest U.S. bank IPO at the time. RBS sold its remaining stake by October 2015. Citizens has operated as a fully independent public company ever since. Headcount was most recently confirmed at 17,570 employees as of December 2023.
Major Mergers, Acquisitions, and Milestones
Rather than one giant deal, Citizens has grown through a series of targeted bolt-on acquisitions. The Franklin American Mortgage purchase, completed for $511 million in August 2018, expanded mortgage operations into Tennessee and Texas.
The Investors Bancorp acquisition was Citizens’ first major bank purchase in nearly two decades. It closed April 7, 2022 for $3.5 billion, adding over 150 branches concentrated in the New York and New Jersey metro area. Around the same time, Citizens closed an HSBC East Coast branch acquisition in February 2022. That deal picked up roughly $9.0 billion in deposits and $2.2 billion in loans, with 80 branches fully transitioned by April 2022. In 2023, the bank launched Citizens Private Bank as a dedicated wealth division. In 2024, Citizens marked the ten-year anniversary of its IPO.
Leadership and Governance
Bruce Van Saun serves as Chairman and CEO. He holds both titles rather than working alongside a separately elected independent board chair. Van Saun has overseen the bank’s post-RBS transformation, from spinoff to independent, acquisitive regional player. That includes the Investors Bancorp and HSBC deals that reshaped its Northeast footprint.
Business Segments and Divisions
Citizens organizes its business into two main areas. Consumer Banking includes the newer Citizens Private Bank and Private Wealth division, serving high- and ultra-high-net-worth clients. Commercial Banking covers lending, leasing, treasury management, and capital markets for mid-market and large corporate clients.
A third piece, Citizens Access, extends the bank’s deposit-gathering reach nationwide through a direct-to-consumer digital brand. It lets Citizens compete for deposits well beyond its 14-state branch footprint.
Financial Performance & Scale
Total Assets and Balance Sheet Size
Citizens reported total assets of $233.8 billion at Q2 2026, up 7% year-over-year, following $226.4 billion at year-end 2025. That’s steady, mid-single-digit organic growth. It contrasts with the acquisition-driven jumps seen elsewhere on this list; no major M&A deal currently inflates Citizens’ balance sheet.
Deposits reached $185.6 billion, up 6% year-over-year. Private Bank deposits climbed to $17.8 billion, a fast-growing slice of the total. Loans and leases totaled $147.5 billion, also up 6%. That puts Citizens’ loan-to-deposit ratio at 79.5% on a spot basis.
Annual Revenue and Net Income
Earnings momentum accelerated through 2026. Q2 2026 net income hit $587 million, up 35% year-over-year and 15% from the prior quarter. Revenue reached $2.283 billion, up 12%. Diluted EPS climbed to $1.30, up 41% year-over-year.
The quarterly progression tells a consistent story. Q1 2026 net income of $517 million gave way to Q2’s $587 million. Both figures comfortably beat Q2 2025’s $436 million. Citizens also reported positive operating leverage of 6.4% year-over-year, alongside improving credit quality, with net charge-offs at just 37 basis points.
Customer Count and Market Share
Citizens operates roughly 1,000 branches across 14 states and the District of Columbia. Dedicated wealth and private-bank centers supplement that network, along with an estimated 3,100 to 3,200 ATMs. That’s a smaller physical footprint than Fifth Third’s post-merger network, concentrated instead in denser East Coast markets.
Business banking, the $5 million to $50 million revenue commercial segment, represented about 12% of Citizens’ deposit base as of mid-2026. The bank is actively expanding this area through new hires in New York, Florida, and California. Trade press generally characterizes Citizens as a top-15 U.S. bank by assets, though precise national deposit market-share figures remain hard to pin down.
Stock Performance and Credit Ratings
Citizens shares closed at $66.84 on September 16, 2026. That gives the company a market capitalization near $28.15 billion. Shares ranged between $47.96 and $75.33 over the trailing 52 weeks, with a dividend yield around 2.75%.
Credit ratings at the holding company sit in solid investment-grade territory. S&P and Fitch both rate Citizens Financial Group BBB+, while Moody’s assigns Baa1. The operating bank carries somewhat stronger ratings, including an A- from S&P. Citizens also reports a CET1 capital ratio of 10.6%, with 67% of deposits insured or secured — metrics the company positions as strong relative to regional-bank peers.
Products, Services & Specialties
Core Banking Products
Citizens offers the standard consumer lineup: checking, savings, CDs, personal and auto loans, credit cards, and a sizeable mortgage business bolstered by the 2018 Franklin American Mortgage deal. Shoppers comparing card offers, including options like a balance transfer card, can weigh Citizens’ lineup against competitors before applying.
On the commercial side, Citizens provides treasury management, foreign exchange, capital markets access, leasing, and lending for mid-market and large corporate clients. Citizens also offers home equity lines of credit and personal lines of credit as part of its broader consumer lending menu.
Specialty Divisions and Niche Strengths
Citizens Private Bank, launched as a distinct division in 2023, represents the bank’s fastest-growing specialty. Deposits alone reached $17.8 billion by Q2 2026. The bank has continued hiring senior wealth leadership through 2026 to accelerate that build-out.
A second specialty push targets the underserved $5 million to $50 million revenue business-banking segment. Citizens’ own business banking president has said larger banks often neglect this gap. The strategy pairs these commercial clients with private and wealth bankers who may also serve the business owners personally. That cross-referral model differentiates Citizens from peers who keep those business lines siloed. It also feeds Citizens Private Bank directly, since many business owners in that targeted segment are themselves candidates for personal wealth management. Citizens Access rounds out the specialty set as a nationwide digital deposit-gathering brand.
Digital Banking and Technology
Citizens launched an enhanced mobile app in 2026, aimed at making the connection between personal and business accounts more transparent within a single platform. The bank also partnered with payroll provider Gusto to embed payroll processing directly into its business online banking experience.
Independent satisfaction rankings specific to Citizens’ digital banking, such as J.D. Power scores, weren’t confirmed in current research. They would need direct verification against the latest studies.
Fees, Rates, and Customer Experience
Citizens is actively reshaping its physical footprint. The bank plans to close 100 to 120 supermarket-based branch locations while opening 50 to 60 new standalone branches nearby. That’s less a retreat than a footprint-quality upgrade, trading lower-traffic supermarket kiosks for purpose-built branches.
On standard fee and rate structures, Citizens competes within typical regional-bank norms. It doesn’t offer the standout discount positioning Schwab provides through its brokerage-linked checking account.
Reputation, Risks & Recent Developments
Regulatory History and Compliance Record
Citizens’ most consequential recent enforcement action came in May 2023. The CFPB imposed a $9 million civil penalty for Truth in Lending Act violations tied to credit card fraud-claim handling. Regulators found that Citizens improperly denied billing-error and unauthorized-transaction claims. It had demanded notarized fraud affidavits that weren’t legally required, a practice that persisted from at least 2010 through early 2016. Customers with legitimate disputes affecting their credit score and credit history had claims wrongly denied under that flawed process. The consent order required refunds and banned the notarization practice going forward.
An earlier action, in August 2015, resulted in roughly $34.5 million in combined penalties and customer refunds. The cause: failing to fully credit customer deposits between 2008 and 2013. Both cases underscore the importance of clear, compliant consumer-disclosure practices in a heavily regulated banking environment. During the 2008 financial crisis, Citizens (then RBS Citizens) posted a $929 million annual loss amid SEC scrutiny over subprime mortgage exposure — one of the rougher chapters in its RBS-owned era.
Competitive Position and Differentiation
Citizens differentiates itself geographically. It’s anchored in the Northeast and Mid-Atlantic rather than the Midwest, with dense exposure to some of the country’s wealthiest metro areas following the Investors Bancorp and HSBC deals. That positioning fits naturally with its growing Private Bank ambitions.
Its growth strategy relies on measured bolt-on acquisitions, not one transformative mega-merger. That contrasts directly with Fifth Third’s Comerica-driven leap. Its Northeast density also means Citizens competes directly with money-center banks in some of its core markets, a tougher competitive set than the Midwest markets Fifth Third dominates. The deliberate targeting of the underserved $5 million to $50 million business segment, paired with private-banking cross-referrals, also sets Citizens apart from peers who treat consumer, business, and wealth banking as separate silos.
Recent News and 2026 Developments
Citizens faced real reputational pressure in 2026 over its financing relationships with private-prison operators. Beginning in January 2026, activist groups organized protests and boycott campaigns. Their target: the bank’s financing ties to GEO Group ($550 million) and CoreCivic ($500 million). Pressure escalated through the year, including the July 2026 “Delaney Hall” protests and Jersey City’s decision to withdraw municipal funds from Citizens in response. The bank subsequently announced it would cease financing these companies, though the controversy had already generated significant negative press. The episode illustrates how financing decisions tied to socially contested industries can create real reputational and political risk for a regional bank operating in socially engaged markets.
Beyond that episode, Citizens kept building. It expanded its Private Bank leadership team in May 2026 and pressed forward with branch network optimization and business-banking growth. Strong Q2 2026 earnings capped the period, with net income up 35% year-over-year.
Strengths, Weaknesses, and Who This Bank Suits
Citizens brings genuine strengths: accelerating 2026 earnings momentum, solid capitalization with a 10.6% CET1 ratio and high insured-deposit share, a fast-growing Private Bank franchise, and a disciplined bolt-on M&A record that avoided a disruptive mega-merger.
Its weaknesses include the 2026 private-prison financing controversy. That drew activist and municipal pushback even after the bank agreed to exit those relationships. Its regulatory history also includes the sizable 2015 deposit-crediting case and the 2023 CFPB credit-card servicing fine. Citizens operates at smaller scale than Fifth Third post-Comerica or Schwab, too, meaning less balance-sheet capacity for the largest commercial clients.
Citizens suits Northeast and Mid-Atlantic consumers and small businesses well. It also fits high-net-worth clients drawn to its expanding Private Bank, and mid-market businesses in the $5 million to $50 million range the bank actively courts. It’s a weaker fit for customers outside its 14-state branch footprint wanting in-person service, and for socially conscious customers wary of the bank’s recent private-prison financing history despite its planned exit. Anyone comparing Citizens against larger peers should weigh both its accelerating earnings trend and its comparatively modest overall scale. Its earnings momentum keeps Citizens Financial Group inside the ranks of the largest banks in North America, even at a more regional scale.
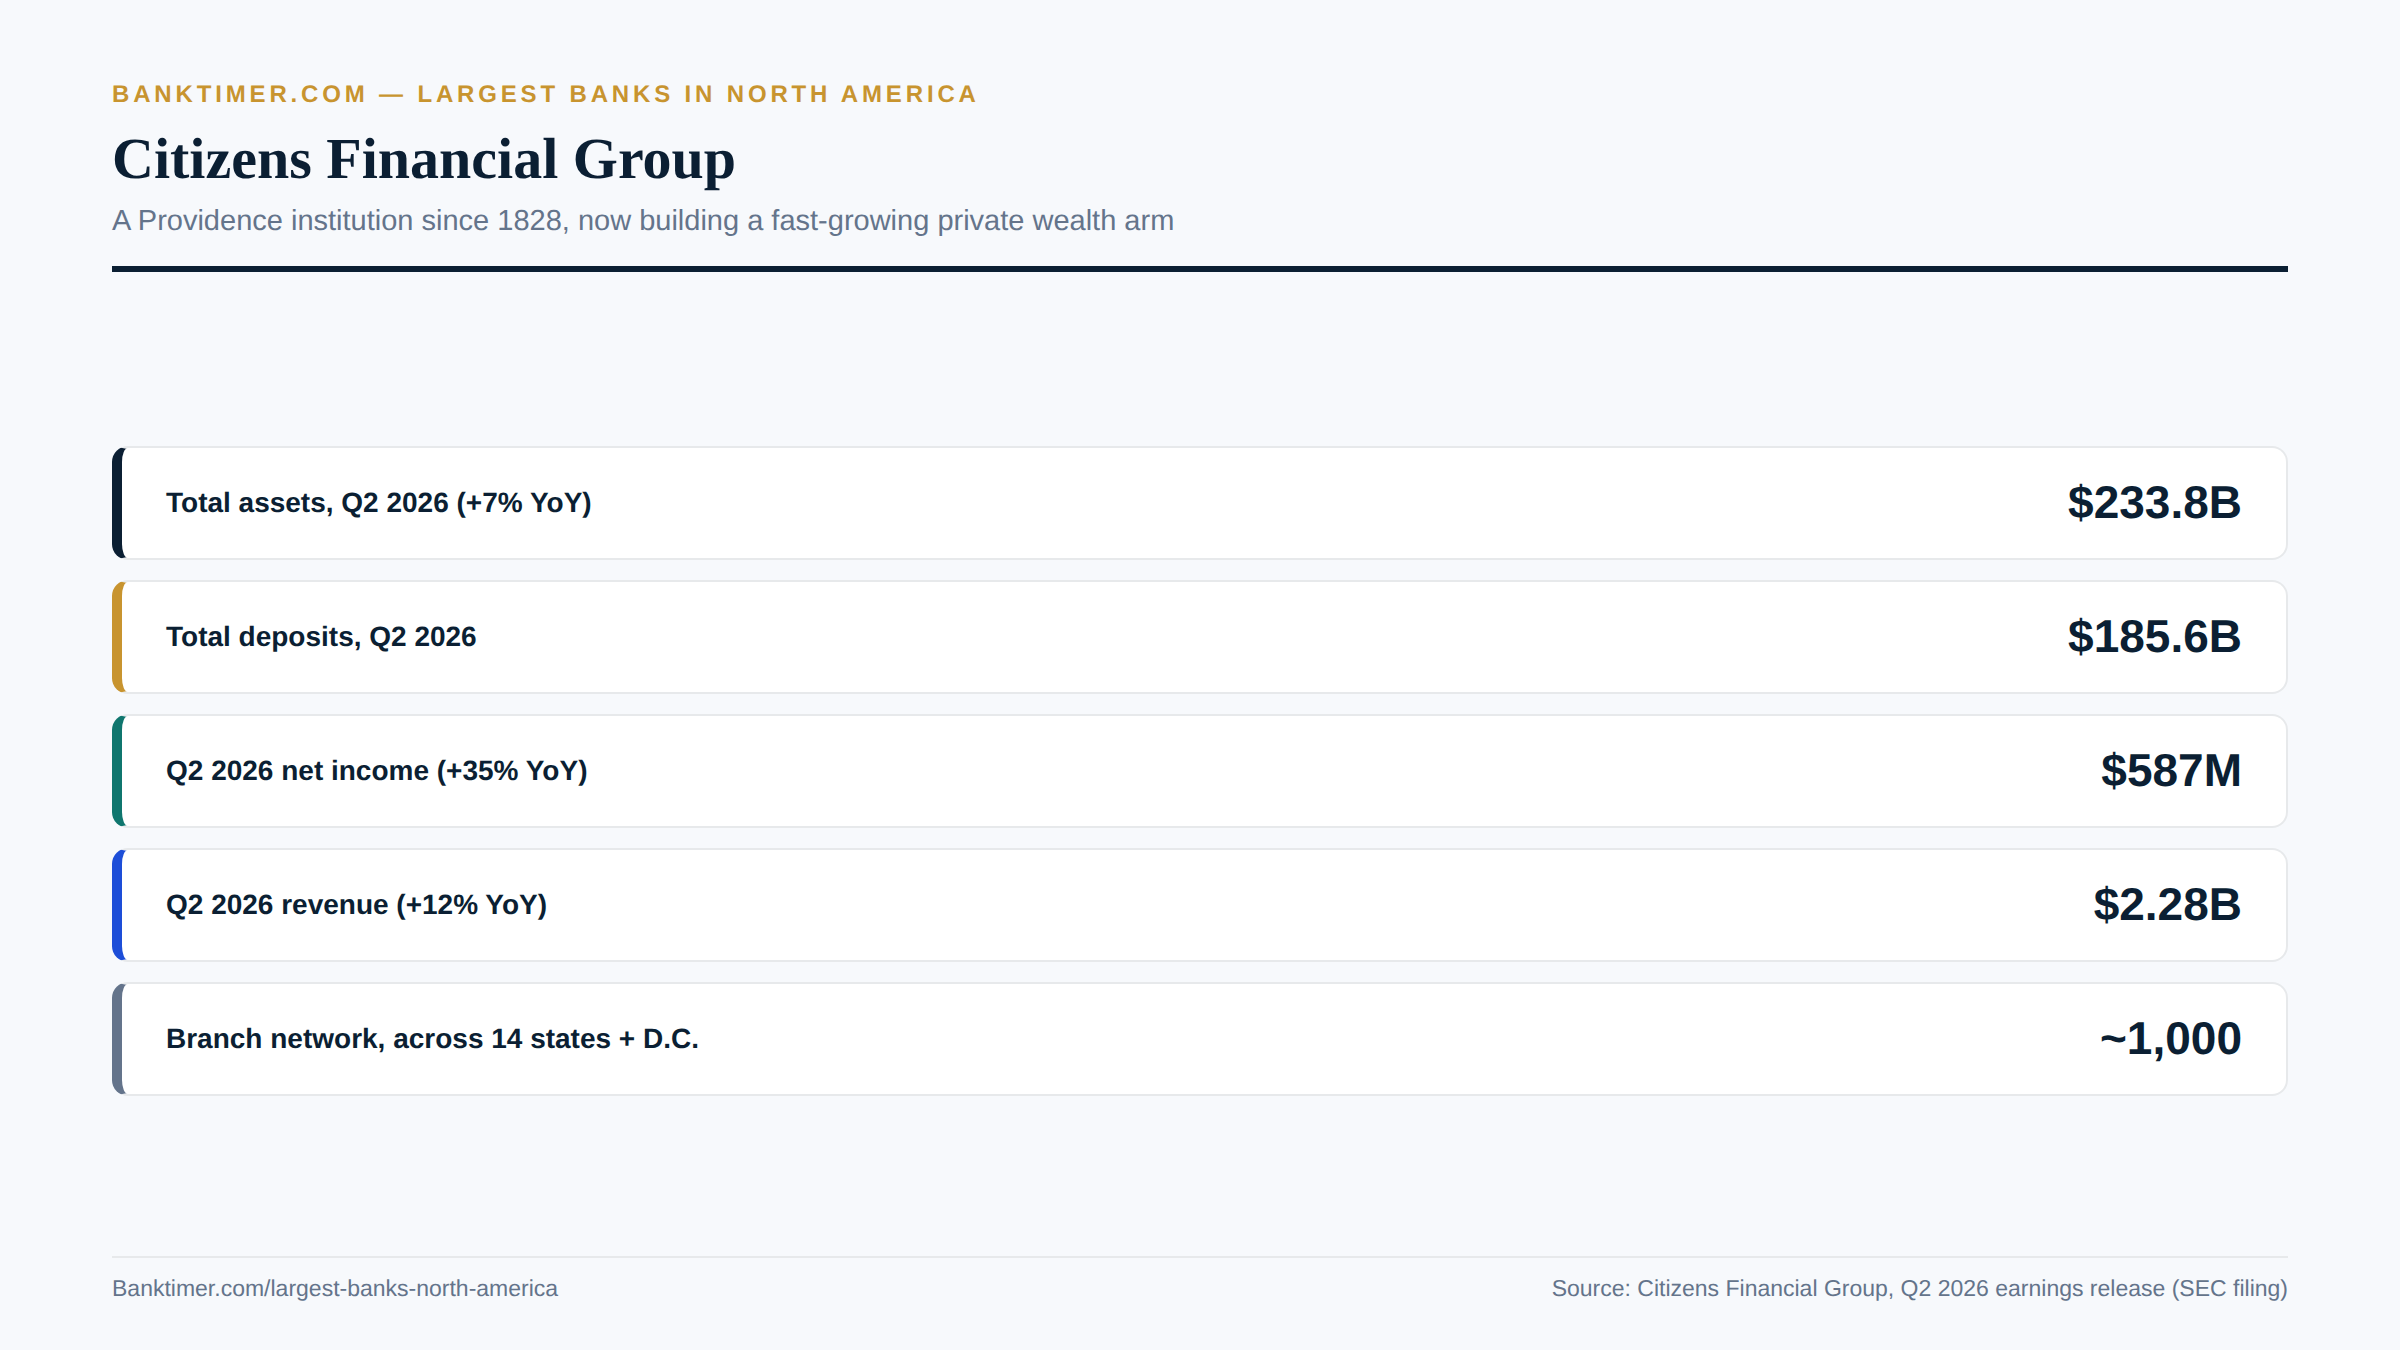
Nearly 200 years old, still growing — Citizens’ Q2 2026 net income jumped 35% year over year
Royal Bank of Canada (RBC)
Royal Bank of Canada started as a Halifax merchant’s bank and grew into the largest financial institution in the country, by both assets and market value. Canadians know it simply as RBC. Outside Canada, it shows up wherever a wealthy client needs private banking in Los Angeles or an investment bank needs a seat at the table on a cross-border deal. The bank now touches 19 million clients worldwide across 29 countries, a footprint that stretches well beyond its Toronto and Montreal offices.
Scale is the headline here. RBC closed its most recent quarter with CA$2.50 trillion (about US$1.79 trillion) in total assets — not just Canada’s biggest bank, but one of the twenty largest banks anywhere in North America. That didn’t happen by accident. Decades of steady domestic dominance, plus a deliberately conservative approach to US expansion, built a balance sheet few peers can match.
RBC earns its spot on this list because it represents the ceiling for what a Canadian-headquartered bank can become without chasing a mass-market US retail build-out. It plays capital markets, wealth management, and insurance at a genuinely global level, while keeping its US presence boutique and profitable rather than sprawling. For anyone comparing North America’s largest banks, RBC is the case study in size achieved through discipline rather than acquisition volume alone. That combination of profitability and discipline is why RBC consistently ranks among the largest banks in North America, not just the largest in Canada.
Corporate Profile & History
Founding, Headquarters, and Corporate Structure
RBC traces its roots to 1864, when it opened in Halifax, Nova Scotia, as the Merchants Bank of Halifax, financing the fishing, timber, and import-export trade that drove the Maritime economy. The bank took its current name, Royal Bank of Canada, in 1901.
Today it runs an unusual dual-headquarters setup. Corporate headquarters sits at Royal Bank Plaza in Toronto, while the registered legal head office remains at Place Ville-Marie in Montreal — a holdover from its original Quebec incorporation. RBC now operates in 29 countries, though Canada still supplies about 63% of revenue, with the US contributing roughly 26% and international operations the rest.
Major Mergers, Acquisitions, and Milestones
RBC built its US wealth-management arm mainly through one transformative deal: the 2015 acquisition of City National Corporation, the Los Angeles private bank known for serving the entertainment industry, for roughly US$5.4 billion. Earlier moves included buying Dain Rauscher Wessels in 2000 and a short-lived push into North Carolina retail banking via Centura Bank in 2001, later exited.
More recently, RBC expanded both overseas and at home. In 2022, it paid about CA$2.4 billion (roughly US$1.7 billion) for UK wealth manager Brewin Dolphin. Then in 2024, it closed its largest-ever domestic deal — the CA$13.5 billion (about US$9.65 billion) acquisition of HSBC Bank Canada — adding a commercial-banking and trade-finance client base that’s still fueling loan growth today.
Leadership and Governance
Dave McKay has run RBC as President and CEO since August 2014. He’s a company lifer: he joined as a co-op student in 1983 and worked his way up through Canadian Banking before taking the top job. He was named Canada’s Outstanding CEO of the Year in 2022, and under his tenure the bank posted record earnings in fiscal 2025.
Jacynthe Côté has chaired RBC’s board since April 2023, overseeing a period that included both the HSBC Canada integration and a sharply raised profitability target for fiscal 2026.
Business Segments and Divisions
RBC organizes itself into five main segments. Personal Banking, its largest by revenue share, dominates Canadian retail. Commercial Banking serves Canadian businesses, while Capital Markets — the 10th-largest global investment bank by fees — handles underwriting and advisory work worldwide.
The US story runs through Wealth Management. City National Bank, RBC’s signature American subsidiary, held about US$98 billion in assets as of April 2026 and runs more than 65 branches as an FDIC-member private and commercial bank. It caters to entertainment, sports, and high-net-worth clients rather than everyday depositors — a boutique model, not a branch-on-every-corner strategy. RBC Insurance rounds things out as Canada’s largest bank-owned life insurer.
Financial Performance & Scale
Total Assets and Balance Sheet Size
As of July 31, 2026, RBC’s balance sheet stood at CA$2,498,817 million — call it CA$2.50 trillion, or roughly US$1.79 trillion at current exchange rates. That’s up from CA$2.325 trillion (about US$1.66 trillion) just nine months earlier, at the October 2025 fiscal year-end.
Deposits reached CA$1.64 trillion (around US$1.18 trillion), and net loans totaled CA$1.11 trillion (about US$792.6 billion). Because RBC, like its Canadian peers, runs an October 31 fiscal year-end, these Q3 figures are the most current available — full fiscal 2026 results won’t land until late November or December.
Annual Revenue and Net Income
RBC’s fiscal 2025 (year ended October 31, 2025) was a record one. Net income hit CA$20.4 billion (about US$14.6 billion), up 25% year over year, on total revenue of CA$66.6 billion (roughly US$47.6 billion). Diluted earnings per share climbed to CA$14.07, and return on equity rose to 16.3%.
The momentum carried into fiscal 2026. Third-quarter net income alone hit CA$6.0 billion — a company record — on revenue of CA$18.5 billion, with return on equity reaching 17.9%. Every major segment except Personal Banking and Insurance grew profits that quarter, with Wealth Management up 32% year over year.
Customer Count and Market Share
RBC serves more than 19 million clients worldwide, of which roughly 11 million bank with RBC Royal Bank in Canada specifically. That reach, combined with its balance sheet, makes RBC the largest bank in Canada by both assets and market capitalization.
Its US footprint tells a different story. City National’s US$98 billion in assets is meaningful but modest next to RBC’s roughly US$1.8 trillion global balance sheet — a reminder that RBC’s American presence is concentrated in wealth and private banking, not mass-market retail.
Stock Performance and Credit Ratings
Shares of RBC (NYSE: RY) closed at US$202.29 on September 16, 2026, near the top of a 52-week range of US$143.13 to US$218.57. That performance pushed market capitalization to roughly US$281 billion by independent trackers, or closer to US$290 billion by RBC’s own investor materials.
Credit ratings stay firmly in the top tier. RBC’s legacy senior debt carries Aa1 from Moody’s and AA- from S&P, while its bail-in-subject senior debt sits a notch lower at A1/A — still investment-grade by a wide margin. Outlooks across agencies are Stable.
Products, Services & Specialties
Core Banking Products
In Canada, RBC Royal Bank delivers the full suite most readers would recognize: checking and savings accounts, mortgages, personal loans backed by RBC’s own credit underwriting process, credit cards, and investment accounts, through 1,263 branches. The bank doesn’t compete domestically on exotic products; it competes on scale and satisfaction scores, and readers weighing the fundamentals in banking basics will find RBC’s Canadian lineup fairly conventional by design.
South of the border, RBC Bank in Georgia offers cross-border banking built specifically for Canadian snowbirds, while City National handles everything from checking accounts to trust and estate planning for its wealthier US clientele.
Specialty Divisions and Niche Strengths
City National is RBC’s most distinctive asset. It built its reputation as the “bank to the stars,” serving entertainment, sports, and high-net-worth clients long before RBC bought it in 2015 — and that boutique culture survived the acquisition largely intact.
RBC Capital Markets, meanwhile, ranks as the 10th-largest global investment bank by fee revenue, a genuinely global franchise rather than just a domestic player. RBC Wealth Management gained further international reach through the 2022 Brewin Dolphin deal in the UK, and RBC Insurance remains Canada’s largest bank-owned life insurer.
Digital Banking and Technology
RBC picked up recognition in online banking excellence awards in 2025, evidence its digital platform holds its own domestically. That said, detailed figures on app-store ratings or active digital-user counts weren’t available in the sources reviewed for this profile, so RBC’s digital reputation is best described as solid rather than precisely quantified for now.
Fees, Rates, and Customer Experience
Customer satisfaction is where RBC quietly outperforms its Canadian rivals. In J.D. Power’s 2025 Canada Retail Banking Satisfaction Study, RBC ranked #1 among the Big Five for a second consecutive year, scoring 611 out of 1,000 versus CIBC’s 607 and BMO’s 606. That’s not a runaway win, but it’s a real and repeated one.
For context, digital-only Tangerine topped the broader market at 683 — a sign that even the traditional bank winning its own category still has room to close the gap with newer, leaner competitors.
Reputation, Risks & Recent Developments
Regulatory History and Compliance Record
RBC’s compliance record includes a few notable blemishes. In 2014, the CFTC fined the bank US$35 million over wash trades and fictitious transactions. In 2022, a CA$800 million class action over unpaid overtime wages was certified against RBC Dominion Securities.
The more serious episode belongs to City National, its US subsidiary. In January 2023, City National settled Department of Justice redlining allegations for US$31 million — at the time the largest redlining settlement in DOJ history — tied to lending-address discrimination in majority-Black and Hispanic Los Angeles neighborhoods. The conduct predates RBC’s full post-acquisition remediation, but it remains a material mark on the US subsidiary’s record.
RBC has also drawn ESG criticism as one of the world’s largest fossil-fuel financiers — an ongoing pressure point rather than a one-time event.
Competitive Position and Differentiation
RBC’s edge among Canada’s Big Three comes down to restraint. Its US arm is a boutique private bank, not a branch-heavy retail network like TD Bank N.A. or BMO Bank N.A. — a strategic choice that limited RBC’s US mass-market exposure and, arguably, its US compliance risk too.
Domestically, RBC pairs that discipline with the strongest customer-satisfaction score among Canada’s largest banks and the country’s biggest, most diversified capital-markets and wealth-management franchise. Against big US banks, RBC’s global scale rivals large regionals, though its US retail brand recognition trails far behind JPMorgan or Bank of America.
Recent News and 2026 Developments
Momentum has been building. RBC’s fiscal 2025 results were record-setting, with net income up 25% and a newly raised return-on-equity target of 17%+ for fiscal 2026. The bank followed through: its third quarter of fiscal 2026 delivered another record, with CA$6.0 billion in net income and return on equity near 18%.
Much of that growth traces back to the 2024 HSBC Canada integration, which continues to drive commercial-banking loan growth well over a year after the deal closed.
Strengths, Weaknesses, and Who This Bank Suits
RBC’s strengths are straightforward: it’s the largest, most diversified Canadian bank, it wins on customer satisfaction, and its conservative US strategy avoided the compliance and integration risk that has weighed on some competitors. The weaknesses are mostly reputational — its fossil-fuel financing profile draws consistent ESG criticism, and City National’s redlining settlement is a real stain on an otherwise clean US record.
RBC suits Canadian mass-market and affluent retail customers well, along with commercial clients and US high-net-worth or entertainment-industry customers who bank through City National. It’s a poor fit for an everyday US retail customer hunting for a large branch network — RBC simply doesn’t compete there the way TD or BMO do. In short: this is a Canadian-market powerhouse with a genuinely global capital-markets reach, plus a small, specialized US presence — not a US-market retail bank. That discipline is exactly why RBC sits near the top of the largest banks in North America, not just Canada’s.
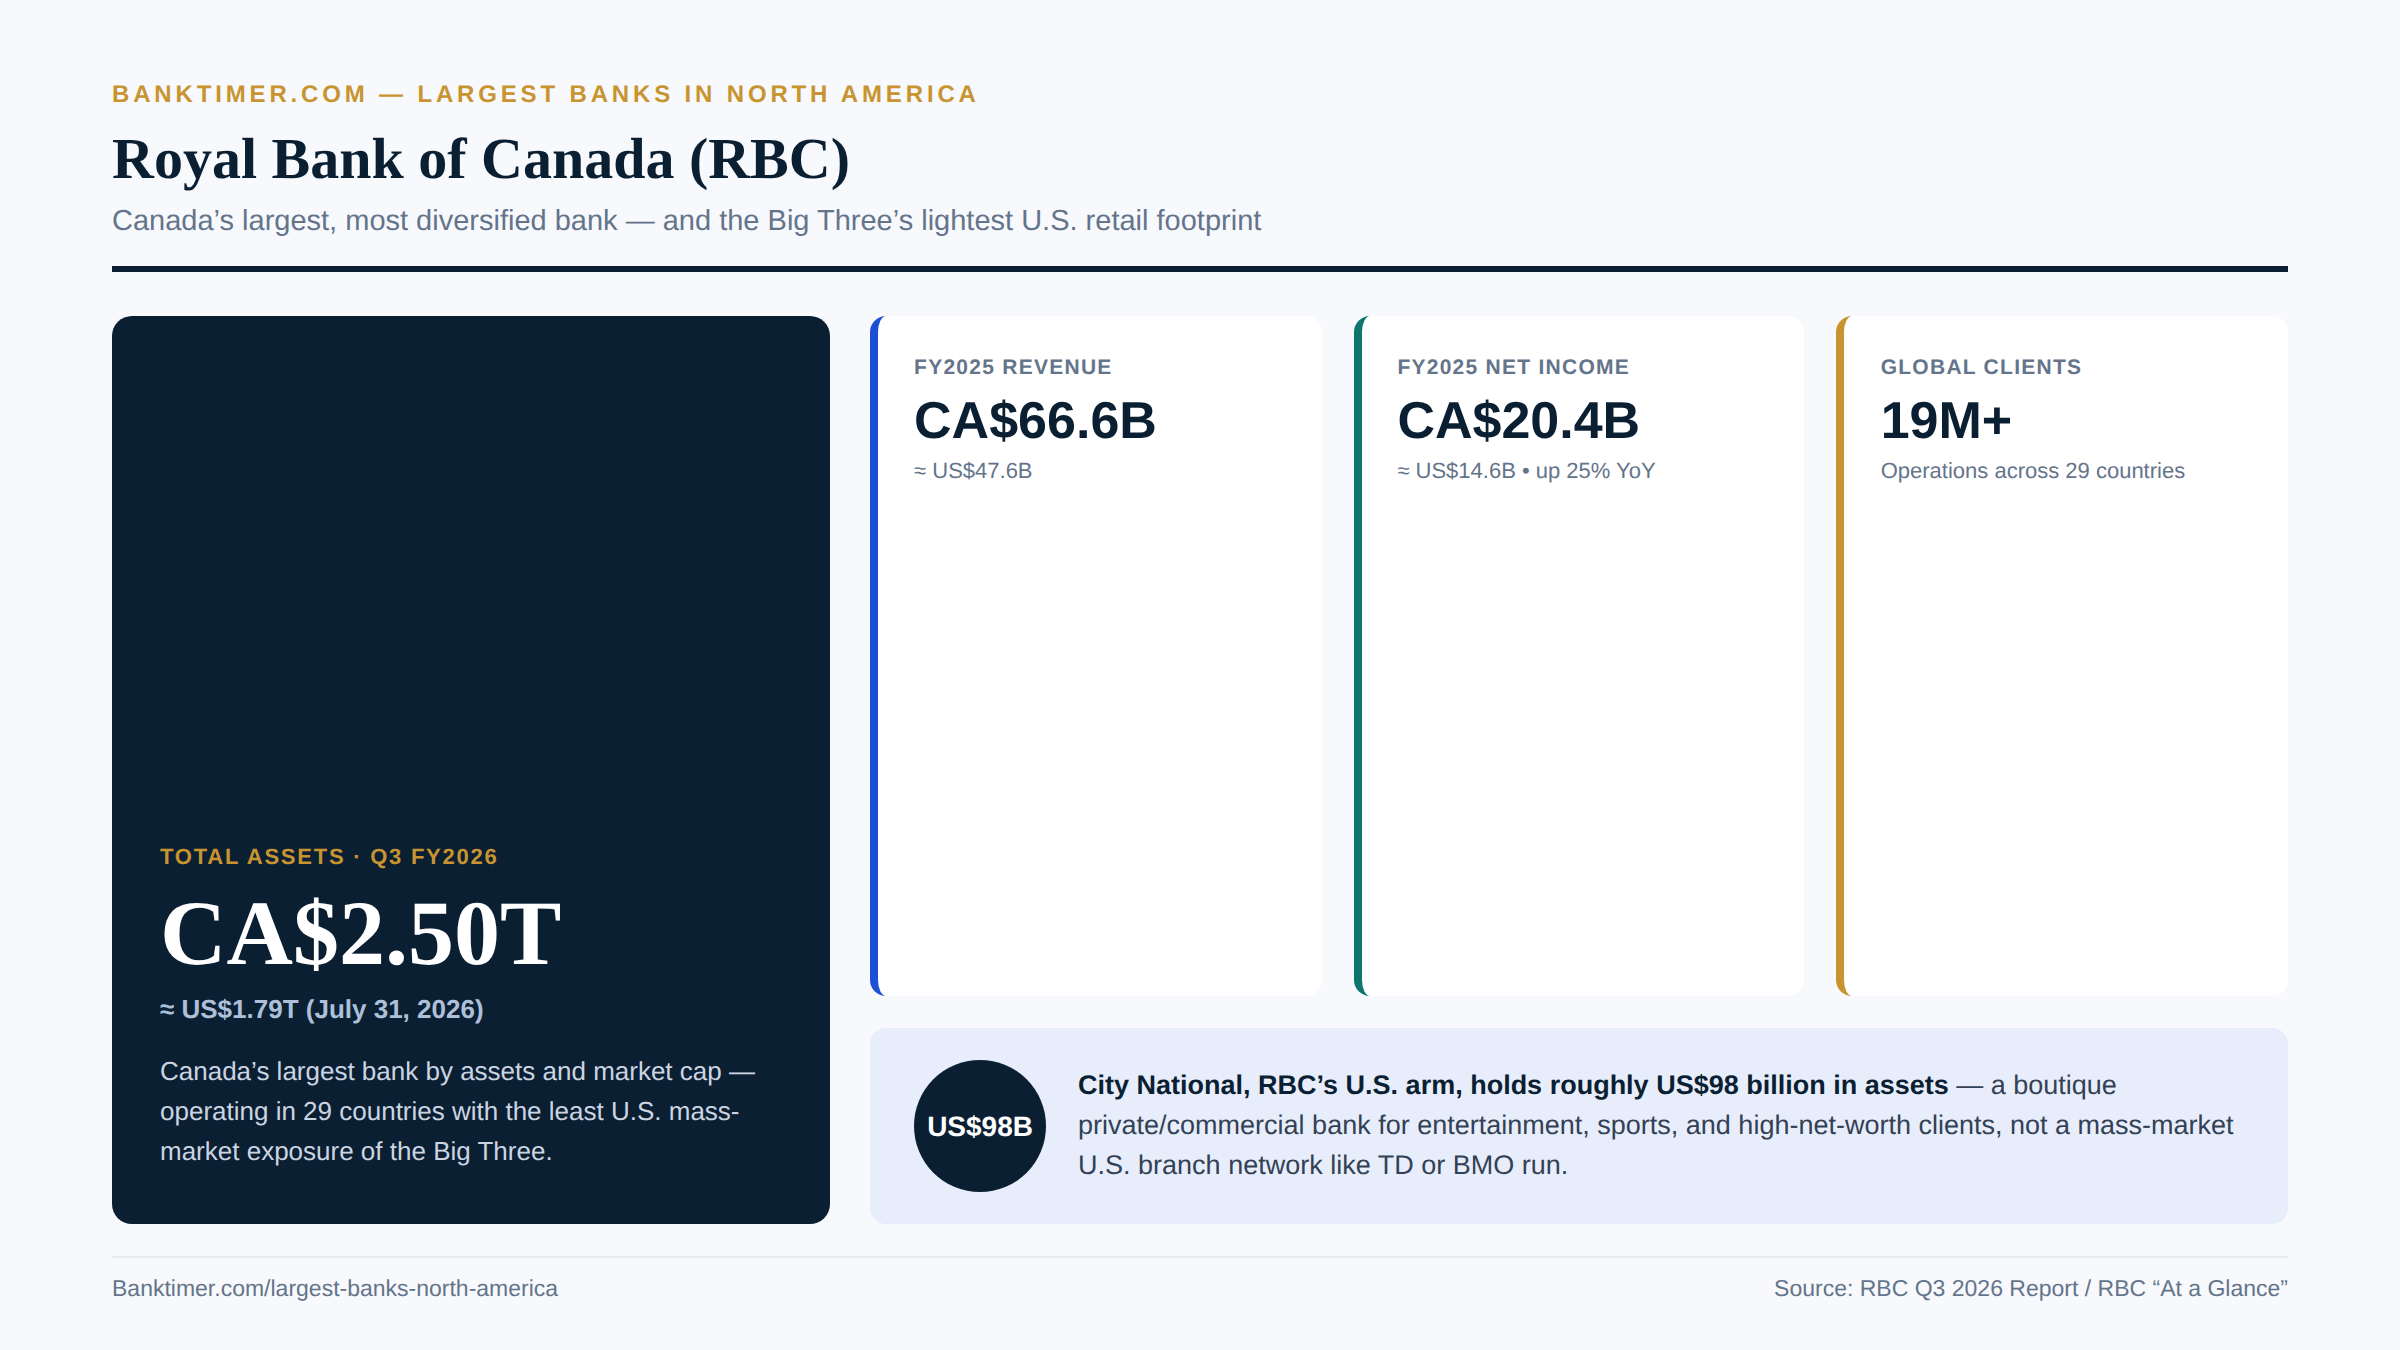
RBC: Canada’s biggest bank, with the smallest U.S. retail footprint of the Big Three
TD Bank Group
TD Bank Group traces back to a 1955 merger and now describes itself simply as “a top 10 North American bank” — an accurate, if modest, way to describe an institution operating on both sides of the border under two very different identities. In Canada, it’s TD Canada Trust. In the US, especially along the East Coast, it’s “America’s Most Convenient Bank” — a genuine mass-market retail brand, not just a subsidiary line in a footnote.
Scale-wise, TD held CA$2,111.9 billion (about US$1.51 trillion) in total assets as of its most recent quarter, spread across 2,085 branches — nearly evenly split between Canada and the US. That dual-market footprint is unusual among Canada’s Big Three: RBC’s US arm is boutique, BMO’s is regional, but TD genuinely competes head-to-head with US banks for everyday retail customers.
TD earns its place on this list for scale, yes, but also because it’s currently the most consequential regulatory story among Canada’s largest banks. A 2024 anti-money-laundering settlement capped the size of TD’s US banking subsidiaries, and that cap remains firmly in place as of this writing — a structural constraint no other bank on this list currently faces. Readers should understand upfront that TD is both a Canadian retail giant and a genuine US retail bank, and that the US side is operating under real regulatory restrictions right now. TD’s dual footprint is exactly why it appears on lists of the largest banks in North America rather than only Canadian rankings.
Corporate Profile & History
Founding, Headquarters, and Corporate Structure
TD Bank Group formed on February 1, 1955, through the merger of the Bank of Toronto (founded 1855) and the Dominion Bank (founded 1869) — a combination that created Canada’s fourth-largest bank at the time, with CA$1.1 billion in assets. The combined bank took the Toronto-Dominion name, headquartered at TD Bank Tower on Wellington Street in Toronto.
The corporate structure now runs on two tracks. TD Bank Group is the Canadian parent, trading as TD on both the TSX and NYSE. Its main US banking subsidiary, TD Bank, N.A. — branded “America’s Most Convenient Bank” — is headquartered in Cherry Hill, New Jersey, alongside a smaller sibling, TD Bank USA, N.A.
Major Mergers, Acquisitions, and Milestones
TD’s US retail ambitions took shape through a string of acquisitions: Banknorth in 2004-05 for US$3.8 billion, then Commerce Bancorp in 2007-08, merged with Banknorth to form TD Bank, N.A. A wave of smaller deals followed, including Chrysler Financial in 2010-11, rebranded TD Auto Finance.
TD also held a long-running stake in TD Ameritrade. When Charles Schwab acquired TD Ameritrade in 2020, TD received roughly 12% of Charles Schwab Corporation stock in return. It fully exited that position in early 2025, banking about US$14.6 billion in proceeds it has since redirected toward share buybacks and simplifying US operations. In 2022, TD also bought Cowen Inc. for US$1.3 billion, rebranding it TD Cowen.
Leadership and Governance
Raymond Chun became President and CEO on February 1, 2025, succeeding Bharat Masrani, who had led TD since November 2014. Masrani’s retirement was announced in September 2024 — around the same time TD finalized its landmark anti-money-laundering settlement, a timing overlap that hasn’t gone unnoticed by industry observers.
John Brent MacIntyre took over as Board Chair on September 1, 2025. TD’s boardroom has seen more turnover in the past two years than either RBC’s or BMO’s, largely a byproduct of the compliance fallout covered below.
Business Segments and Divisions
Canadian Personal and Commercial Banking remains TD’s largest earnings contributor, built on 1,037 Canadian branches and roughly 16 million Canadian customers. But TD’s US Retail segment — TD Bank, N.A., TD Bank USA, N.A., and TD Auto Finance combined — is genuinely substantial too, contributing about 22.6% of segment earnings from 1,048 US branches spanning 15 states and Washington, D.C., mostly along the East Coast from Maine to Florida.
That makes TD Bank, N.A. the 15th-largest US bank by deposits and assets — a real mass-market competitor, not a niche subsidiary. It’s also the segment most directly affected by the regulatory asset cap covered later in this profile. Wholesale Banking, through TD Securities and TD Cowen, rounds out the structure.
Financial Performance & Scale
Total Assets and Balance Sheet Size
TD closed fiscal 2025 (year ended October 31, 2025) with total assets of CA$2,094.6 billion, about US$1.50 trillion. That grew slightly to CA$2,111.9 billion (roughly US$1.51 trillion) by the third quarter of fiscal 2026, ended July 31, 2026.
Total loans sat near CA$991 billion, and deposits reached roughly CA$1.26 trillion. Growth has been modest rather than explosive lately — unsurprising, given that TD’s US banking subsidiaries are currently barred from growing their balance sheet at all under the terms of the 2024 settlement.
Annual Revenue and Net Income
Fiscal 2025 delivered reported net income of CA$20.5 billion (about US$14.68 billion) on total revenue of CA$67.8 billion (roughly US$48.45 billion), with diluted EPS of CA$11.56 and return on equity of 17.8%.
The third quarter of fiscal 2026 brought reported net income of CA$4,615 million, or adjusted net income of CA$4,671 million, with return on equity around 16%. One line item stands out: TD guided to roughly US$550 million in pre-tax AML remediation spending for fiscal 2026 alone, a direct, ongoing drag tied to its 2024 settlement.
Customer Count and Market Share
TD serves about 28.2 million customers globally — roughly 16 million through Canadian Personal and Commercial Banking and more than 10 million through US Banking. TD Bank, N.A.’s ranking as the 15th-largest US bank by deposits confirms this isn’t a token US presence; it’s a genuine, coast-spanning retail franchise.
Digital engagement runs higher in the US than in Canada, interestingly: 94% of US clients count as digitally engaged versus 80.9% in Canada, even though TD’s Canadian mobile-user base (8.9 million) dwarfs its US base (5.2 million) in absolute terms.
Stock Performance and Credit Ratings
TD shares (NYSE: TD) closed at US$120.60 on September 16, 2026, within a 52-week range of US$77.06 to US$125.47, putting market capitalization around US$199.7 billion. Analysts remain broadly positive: 14 analysts rate the stock a Buy, with an average price target near US$123.
Credit ratings stay solid despite the compliance overhang. TD’s deposit and counterparty ratings sit at Aa1 (Moody’s) and AA+ (Fitch), both Stable, though senior debt ratings run a notch or two lower — a gap that reflects the bail-in structure common to Canadian bank debt rather than any acute credit concern.
Products, Services & Specialties
Core Banking Products
TD Canada Trust covers the standard menu across 1,037 Canadian branches: checking and savings accounts — including options like a joint bank account for shared households — plus credit cards, mortgages, personal and auto loans, and investing through TD Direct Investing. For readers weighing credit card basics, TD’s Canadian lineup is broad and mainstream rather than niche.
In the US, TD Bank, N.A. built its brand on convenience: extended hours and weekend banking across checking, savings, mortgages, home equity, and small-business lending, delivered through 1,048 branches from Maine to Florida. TD Auto Finance, inherited from the old Chrysler Financial business, handles indirect auto lending in both countries.
Specialty Divisions and Niche Strengths
TD Cowen, the investment bank TD acquired for US$1.3 billion in 2022, brings genuine US equity-research and healthcare/biotech banking expertise most Canadian-bank-owned US units simply don’t have. TD Auto Finance gives TD real scale in indirect auto lending on both sides of the border.
TD Wealth and TD Direct Investing anchor the Canadian brokerage side. TD also still maintains an insured-deposit-account relationship with Charles Schwab, even after fully exiting its Schwab equity stake — a quieter, ongoing piece of the TD-Schwab relationship.
Digital Banking and Technology
TD reports roughly US$141 million in “AI value unlocked” across the first three quarters of fiscal 2026 — a specific, quantified figure that’s more concrete than what most competitors disclose. Self-serve transaction rates run high in both markets: 93.2% in Canada and 86.7% in the US.
Leadership changes effective September 4, 2026, were announced to “strengthen key capabilities,” though TD hasn’t published granular detail on what that means in practice.
Fees, Rates, and Customer Experience
TD’s US retail brand still resonates with customers, compliance issues notwithstanding. In J.D. Power’s 2025 US Retail Banking Satisfaction Study, TD Bank tied for #1 in the Florida region with Fifth Third Bank, scoring 688 — its second consecutive year holding that regional title.
That’s a genuinely strong showing, and it suggests TD’s day-to-day branch experience hasn’t suffered even as the parent company works through a multi-year regulatory remediation process behind the scenes.
Reputation, Risks & Recent Developments
Regulatory History and Compliance Record
On October 10, 2024, TD announced a “Global Resolution” with US authorities — the OCC, the Federal Reserve, FinCEN, and the Department of Justice — plus a parallel penalty from Canada’s FINTRAC. Combined, the penalties totaled roughly US$3.0 billion: US$1.3 billion to FinCEN, a record at the time for a US bank; US$1.8 billion to the DOJ alongside a guilty plea to a money-laundering conspiracy charge; and US$123.5 million to the Federal Reserve. TD became the first major US bank to plead guilty to such a charge.
TD admitted to willfully neglecting its anti-money-laundering program for over a decade, allowing trillions of dollars in potentially suspicious transactions to pass unmonitored. That included more than US$670 million funneled through a Chinese organized-crime money-laundering network, along with drug-trafficking- and human-trafficking-linked transactions routed through peer-to-peer payment rails.
Here’s the part that matters most for anyone sizing up TD today. The OCC’s consent order imposed a hard “Asset Limitation” on TD’s combined US banking subsidiaries — TD Bank, N.A. and TD Bank USA, N.A. — capping their combined total assets at US$434 billion, frozen at the level recorded on September 30, 2024. If TD fails to hit compliance milestones, the OCC can force additional asset reductions of up to 7% per year on top of that.
As of TD’s third-quarter fiscal 2026 earnings release, reported around August 2026, that cap remains fully in effect. TD’s own materials state that “significant work and important milestones remain for calendar 2026 and calendar 2027,” specifically flagging a suspicious-activity-report lookback that management doesn’t expect to finish until 2027. In plain terms, TD Bank, N.A. cannot grow its US balance sheet through deposits, loans, or acquisitions until regulators lift the cap — a structural handicap neither RBC’s City National nor BMO’s US bank currently faces.
Competitive Position and Differentiation
TD’s US franchise is, on paper, the strongest of Canada’s Big Three — 1,048 branches genuinely competing with US regionals along the East Coast, versus RBC’s boutique City National or BMO’s Midwest-focused network. But the asset cap is the defining fact right now: TD is the only one of the three Canadian banks with a hard, regulator-imposed ceiling on US balance-sheet growth, even while US Banking remains its second-largest earnings segment.
The Schwab-stake exit at least freed up capital — roughly US$14.6 billion — to offset some of the AML-related earnings drag through buybacks and reinvestment.
Recent News and 2026 Developments
Leadership has fully turned over since the scandal broke: Raymond Chun took the CEO seat in February 2025, and John Brent MacIntyre became Board Chair in September 2025. On the growth side, TD announced a five-year, CA$150 billion commitment in September 2026 to new Canadian lending, underwriting, and advisory activity — a striking contrast with its frozen US balance sheet.
TD’s third quarter of fiscal 2026 still came in as a record quarter by adjusted measures, with adjusted net income of CA$4.7 billion, driven by Canadian earnings and wholesale strength even as AML remediation costs — still running near US$550 million a year — continue weighing on the US segment. The asset cap itself remains unresolved, with no indication as of September 2026 that regulators plan to lift it before the SAR lookback wraps up in 2027.
Strengths, Weaknesses, and Who This Bank Suits
TD’s strengths are real: a genuinely large US retail footprint, strong Canadian and wholesale franchises, and freed-up capital from the Schwab exit. But the weaknesses are hard to overstate. TD is the only Canadian Big Three bank under an active US asset cap, it’s paying roughly half a billion dollars a year in remediation costs, and it carries the reputational weight of being the first major US bank to plead guilty to money laundering.
TD suits Canadian retail and commercial customers well, and it still works fine for existing US East Coast customers who value branch convenience. It’s a poor fit for anyone — investor or corporate client — looking for a Canadian bank with unconstrained US growth ambitions, or for a US customer who weighs a bank’s compliance record heavily. Of the three Canadian banks in this report, TD carries by far the heaviest compliance overhang, and it’s the clearest example here of a bank that is simultaneously Canadian-market and true US-market, with the US side currently operating under real, regulator-imposed limits. Regulatory limits aside, TD Bank Group’s combined footprint keeps it counted among the largest banks in North America.
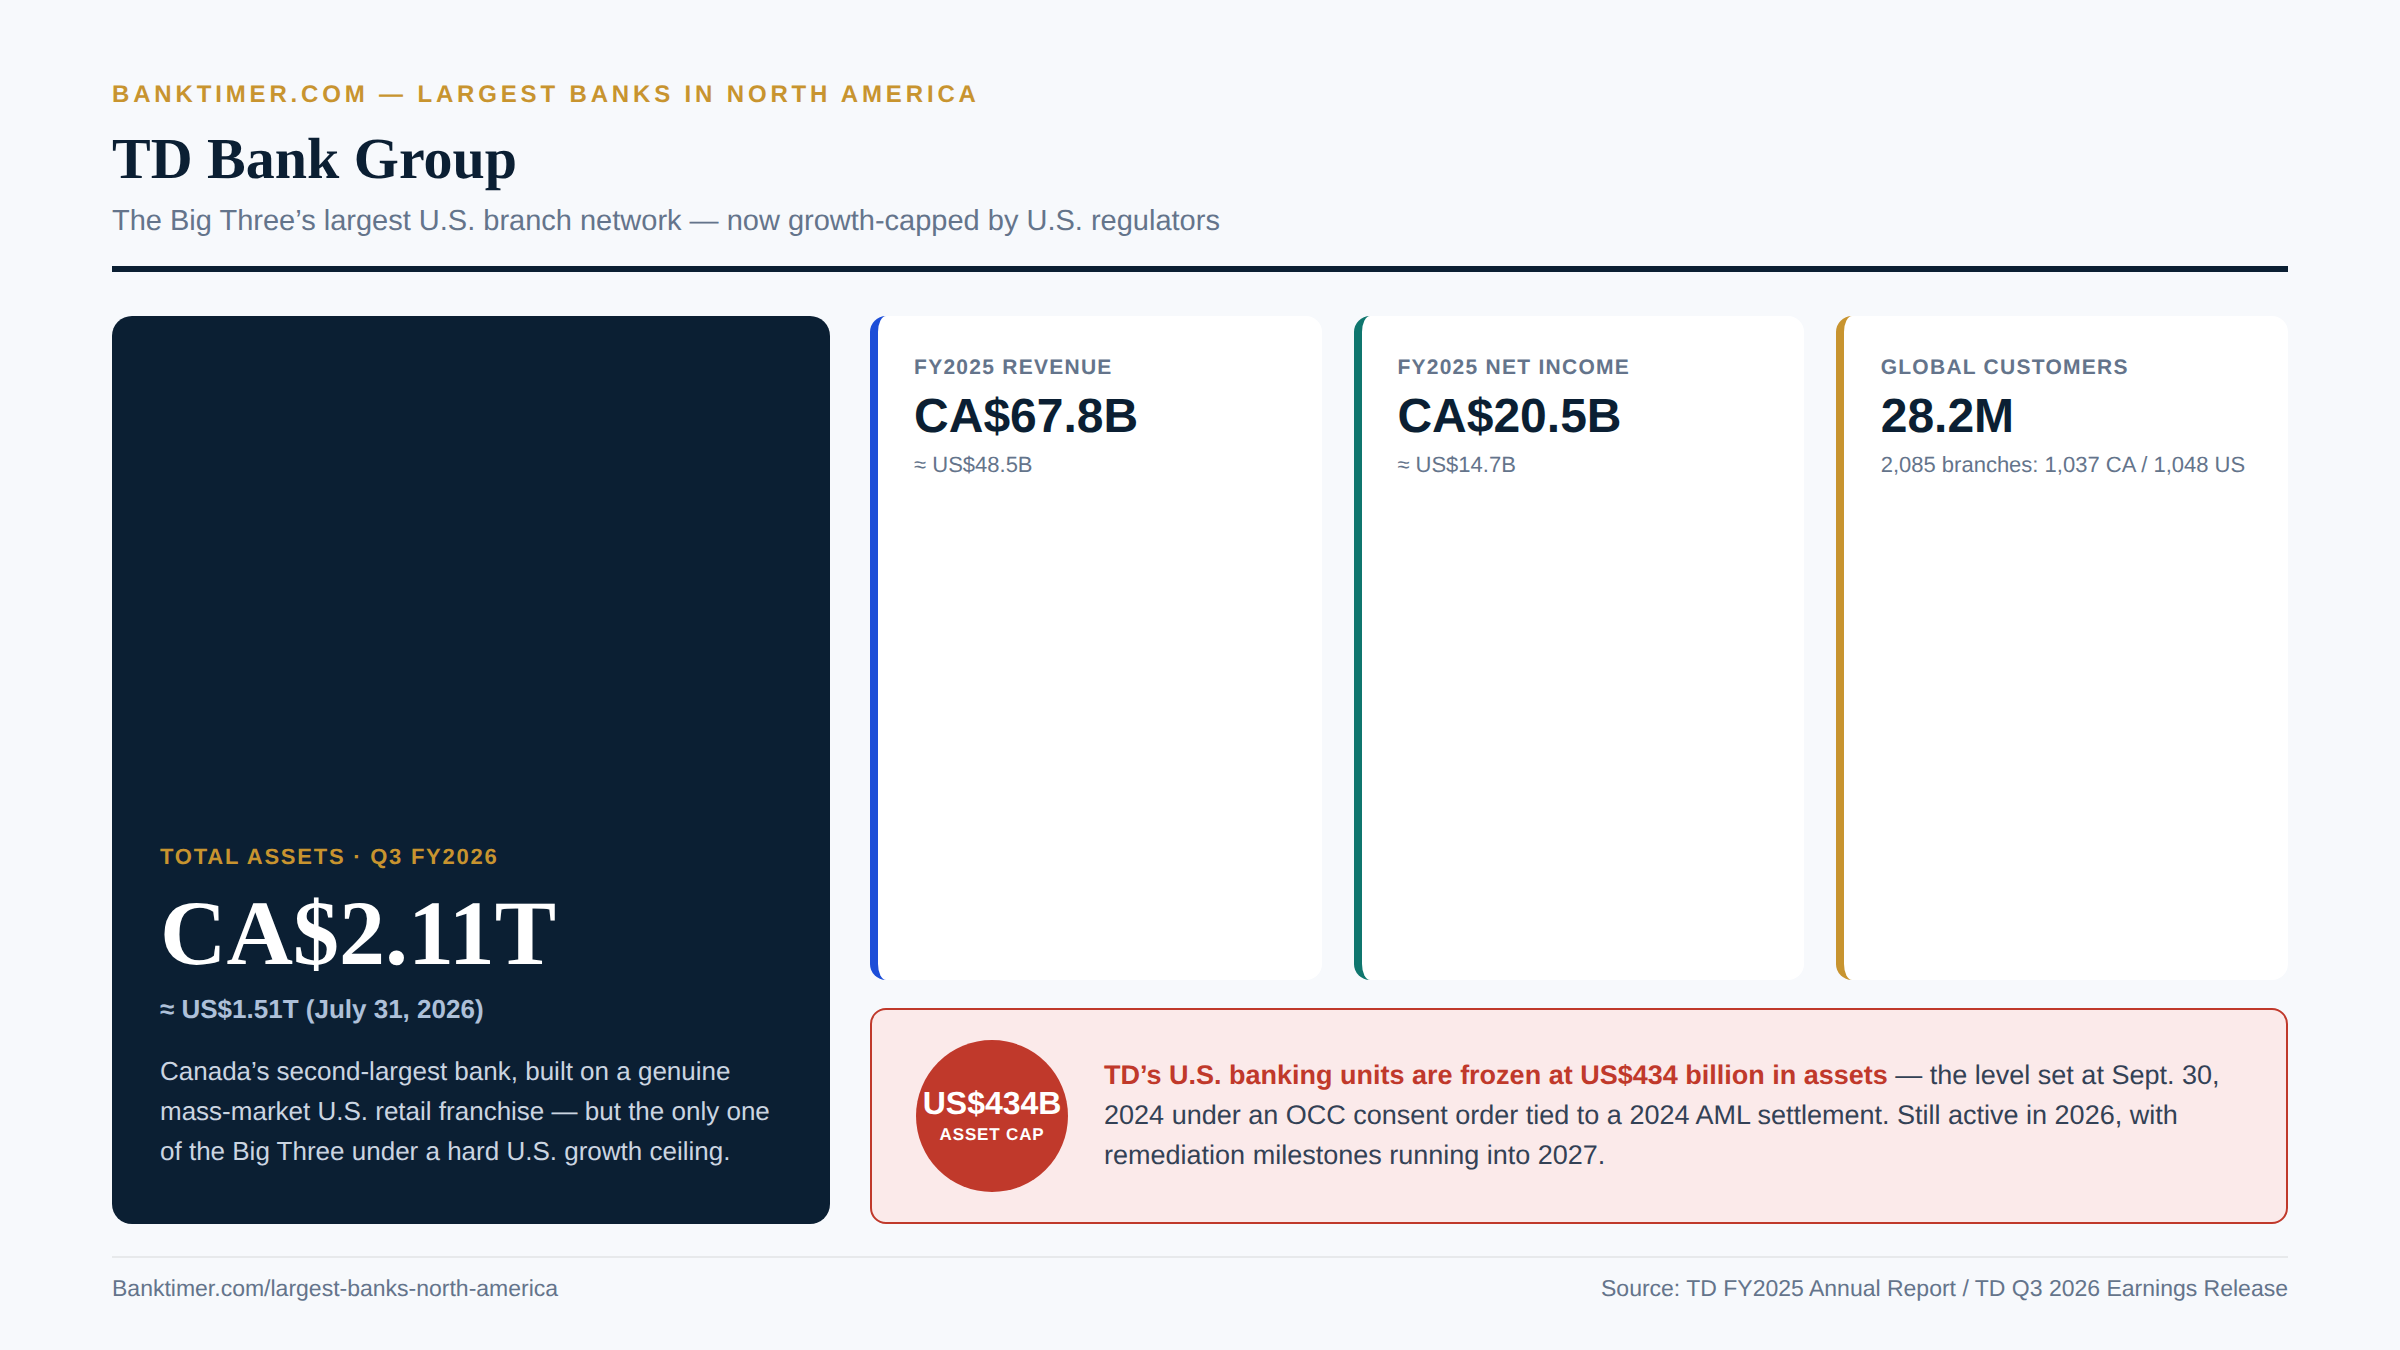
TD’s U.S. arm is frozen at $434B — the only Canadian Big Three bank under an active asset cap
Bank of Montreal (BMO Financial Group)
Bank of Montreal is Canada’s oldest bank, chartered in 1817, decades before Confederation itself. It operates today as BMO Financial Group, a name recognized across Canada and, since a major 2023 rebrand, across ten US states as well. BMO is also mid-transition right now: it just finished trimming its US branch network and absorbing a large one-time charge, so a reader looking at this bank today is looking at a company actively reshaping itself, not standing still.
On scale, BMO describes itself as “the eighth-largest bank in North America by assets,” with total assets of CA$1.5 trillion (about US$1.07 trillion) as of July 31, 2026. That puts it behind RBC and TD among Canada’s Big Three, but still solidly ahead of most US regional banks.
BMO belongs on this list for its history and its US footprint, which spans the Midwest through legacy Harris Bank territory and the West Coast through the 2023 Bank of the West acquisition — a genuinely broad American presence, even after a recent pullback from lower-growth rural markets. Like RBC, this is fundamentally a Canadian-market bank with a substantial, if currently shrinking, US retail arm. Even after trimming its US footprint, BMO remains solidly ranked among the largest banks in North America.
Corporate Profile & History
Founding, Headquarters, and Corporate Structure
BMO opened its doors on June 23, 1817, as Montreal Bank — Canada’s first bank, full stop. It went public in 1822 with 144 shareholders and later took the Bank of Montreal name it still carries.
Like RBC, BMO runs a split headquarters: its legal head office sits in Montreal, while its operating headquarters has been at First Canadian Place in Toronto since 1977. Globally, the bank operates as BMO Financial Group, serving roughly 13 million customers.
Major Mergers, Acquisitions, and Milestones
BMO’s American story began in 1984 with the purchase of Chicago’s Harris Bankcorp, later rebranded BMO Harris Bank, followed by smaller Chicago-area deals in the 1990s. The 2010 acquisition of Marshall & Ilsley Corporation, a Milwaukee bank, expanded that Midwest base — though it also left BMO holding a major legacy legal liability, discussed below.
The transformative deal came more recently. BMO agreed in 2021 to buy San Francisco-based Bank of the West from BNP Paribas for US$16.3 billion, closing in February 2023. BMO then retired the Harris brand entirely, consolidating everything under the single global “BMO” name and headquartering US operations at BMO Tower in Chicago. In September 2026, BMO sold 138 US branches to First Citizens Bank, pulling back from rural Plains-state markets to redeploy capital toward higher-growth areas.
Leadership and Governance
Darryl White has served as CEO since November 2017, and remained at the helm through BMO’s third quarter of fiscal 2026, crediting “disciplined execution” against commitments made at the bank’s March 2026 Investor Day. George Cope has chaired the board since May 2020.
Compared with TD’s recent leadership churn, BMO’s executive team looks notably stable — worth noting for anyone weighing governance continuity as a factor.
Business Segments and Divisions
The Personal and Commercial Client Group anchors BMO’s Canadian retail and commercial banking, and remains its largest earnings contributor. U.S. Banking, run as BMO Bank, N.A., is the direct descendant of Harris Bank and Bank of the West, now unified under one brand and operating from Chicago. Pre-divestiture, it ran more than 600 branches and roughly 1,300 ATMs across ten states — Illinois, Iowa, Wisconsin, Indiana, Kansas, Missouri, Minnesota, Arizona, Florida, and California — ranking as the 15th-largest US bank by total assets and the second-largest bank in the Chicago market, behind only JPMorgan Chase.
Following the September 2026 sale of 138 branches, that US footprint is now more concentrated in core growth markets, especially California and greater Chicago. BMO Capital Markets and the Private Client Group, home to the BMO Nesbitt Burns wealth brand, round out the structure.
Financial Performance & Scale
Total Assets and Balance Sheet Size
BMO ended fiscal 2025 with total assets of CA$1.477 trillion (about US$1.056 trillion), growing to CA$1.5 trillion (roughly US$1.07 trillion) by the third quarter of fiscal 2026, ended July 31, 2026. That figure, by BMO’s own description, makes it the eighth-largest bank in North America by assets — smaller than RBC or TD, but still a substantial balance sheet by any global standard.
Annual Revenue and Net Income
Fiscal 2025 revenue came to CA$36.27 billion (about US$25.9 billion), with net income of CA$8.73 billion (roughly US$6.24 billion). The third quarter of fiscal 2026 looked messier on paper: reported net income fell 25% year over year to CA$1,750 million, dragged down by a CA$1,092 million goodwill charge tied to selling BMO’s Transportation Finance and Vendor Finance businesses.
Strip that one-time item out, though, and the picture flips. Adjusted net income actually rose 19% to CA$2,859 million, with adjusted return on equity climbing to 14.0% from 12.0% a year earlier, on revenue up 10% to CA$9,896 million.
Customer Count and Market Share
BMO serves roughly 13 million customers globally — fewer than RBC or TD, consistent with its position as the third-largest of Canada’s Big Three by most measures. In the US, BMO Bank, N.A. ranks as the 15th-largest bank by total assets and the second-largest bank in the Chicago metro area by market share, trailing only JPMorgan Chase.
BMO frames its own position plainly: the eighth-largest bank in North America by total assets, just behind its Canadian peers but ahead of most American regional competitors.
Stock Performance and Credit Ratings
BMO shares (NYSE: BMO) closed at US$172.60 on September 16, 2026, within a 52-week range of US$119.84 to US$187.22 — a roughly 33% gain over the trailing period. Market capitalization sits around US$120.7 billion, the smallest of the three Canadian banks profiled here, though still a large-cap institution by global standards.
Credit ratings run a notch below RBC’s: Aa2 from Moody’s, A+ from S&P, and AA from Fitch, per the most recent tracker data available — solidly investment-grade, if slightly less pristine than RBC’s top-tier ratings.
Products, Services & Specialties
Core Banking Products
In Canada, the Personal and Commercial Client Group offers the expected lineup — checking and savings accounts, mortgages, credit cards (including balance-transfer options for anyone consolidating debt; see our balance transfer card breakdown), and personal and business loans — through BMO’s domestic branch network. Readers exploring banking basics will find BMO’s Canadian products fit the standard big-bank mold rather than breaking new ground.
In the US, BMO Bank, N.A. delivers checking, savings, mortgages, home equity, and business loans through a branch network that’s now more concentrated following the September 2026 sale of 138 branches to First Citizens Bank.
Specialty Divisions and Niche Strengths
BMO Capital Markets posted the strongest year-over-year growth of any BMO division in the third quarter of fiscal 2026, with net income up 46%, suggesting real momentum in trading and underwriting. BMO Nesbitt Burns remains the legacy wealth-management brand within the Private Client Group.
Beyond traditional banking, BMO has moved aggressively into Canadian growth-sector investing: a CA$70 billion, 10-year commitment to critical economic sectors including AI infrastructure, plus a direct investment in Radical Ventures’ AI-focused “Breakouts Fund” announced in September 2026. That’s a notably active institutional-investor posture, not just a lender’s role.
Digital Banking and Technology
CEO Darryl White has framed AI as a strategic priority, describing plans to “personalize client experiences, augment employee capabilities, and automate processes while maintaining responsible AI governance.” Specific app-store ratings or digital-user counts for BMO weren’t available in the research for this profile, so its digital performance is harder to benchmark precisely against RBC or TD at this level of detail.
Fees, Rates, and Customer Experience
BMO trails its Canadian peers on customer satisfaction. In J.D. Power’s 2025 Canada Retail Banking Satisfaction Study, BMO scored 606 out of 1,000, good for third among the Big Five, behind RBC’s 611 and CIBC’s 607. In the US, BMO didn’t place among the top banks in any of the 15 regions J.D. Power measured in 2025 — a notably weaker showing than TD’s regional win in Florida.
BMO has responded with product moves: enhanced “Blue Rewards” everyday-banking benefits and commission-free stock and ETF trading, both launched in September 2026, aimed squarely at improving its retail value proposition.
Reputation, Risks & Recent Developments
Regulatory History and Compliance Record
BMO’s compliance history includes a 2019 SEC settlement, in which its Chicago-based units paid US$38 million for hiding conflicts of interest from clients, and a 2018 cybersecurity incident in which hackers claimed to have accessed roughly 50,000 customer records at BMO and its Simplii Financial brand.
The most serious reputational episode came in 2020, when a 12-year-old Indigenous girl and her grandfather were handcuffed by police after a Vancouver BMO branch flagged an ID discrepancy while they tried to open an account. BMO settled with a monetary payment, a public apology, and internal policy changes.
BMO also carries a significant legacy legal liability: a US$834 million judgment tied to Marshall & Ilsley Bank’s role in the Thomas Petters Ponzi scheme, assumed when BMO acquired the bank in 2010. The current appellate status of that judgment wasn’t confirmed in the research for this piece.
Competitive Position and Differentiation
BMO’s edge is heritage and breadth. As Canada’s oldest bank, it carries brand history neither RBC nor TD can claim, and its US footprint — spanning the Midwest and West Coast via Harris Bank, Marshall & Ilsley, and Bank of the West — is geographically the broadest of the three, even after the 2026 pullback.
That said, BMO’s customer-satisfaction scores lag both domestically and in the US, where it hasn’t won a single regional J.D. Power title the way TD has. Its Capital Markets arm, however, is currently outgrowing its counterparts at RBC and TD on a percentage basis.
Recent News and 2026 Developments
BMO has been busy. It completed the 138-branch sale to First Citizens Bank on September 4, 2026, and reported third-quarter results three weeks earlier showing a reported-earnings hit from the Transportation and Vendor Finance divestiture, even as adjusted profitability improved. Then came a string of growth announcements: enhanced Blue Rewards benefits and commission-free trading in early September, a CA$70 billion Canadian capital commitment on September 11, and the Radical Ventures AI investment on September 15.
Taken together, 2026 looks like a year of BMO simplifying its US footprint while doubling down on Canadian growth sectors and capital markets — a deliberate strategic pivot rather than a reaction to any single event.
Strengths, Weaknesses, and Who This Bank Suits
BMO’s strengths include its long operating history, a genuinely diverse US retail base spanning the Midwest and West Coast, strong recent Capital Markets momentum, and a proactive — rather than regulator-forced — reshaping of its US branch network. Its weaknesses include the lowest Canadian customer-satisfaction score of the Big Three profiled here, no top-ranked US region in J.D. Power’s most recent study, and lingering legacy liabilities from past acquisitions.
BMO suits Canadian retail and commercial customers, US Midwest and Chicago-area customers from the old Harris Bank base, and West Coast customers inherited through Bank of the West. It’s a weaker fit for customers in the rural Plains states BMO just exited, or for any US retail customer specifically prioritizing top-tier, J.D. Power-validated service — an area where BMO currently lags TD. Even after recent divestitures, BMO’s combined Canadian and US footprint keeps it among the largest banks in North America.
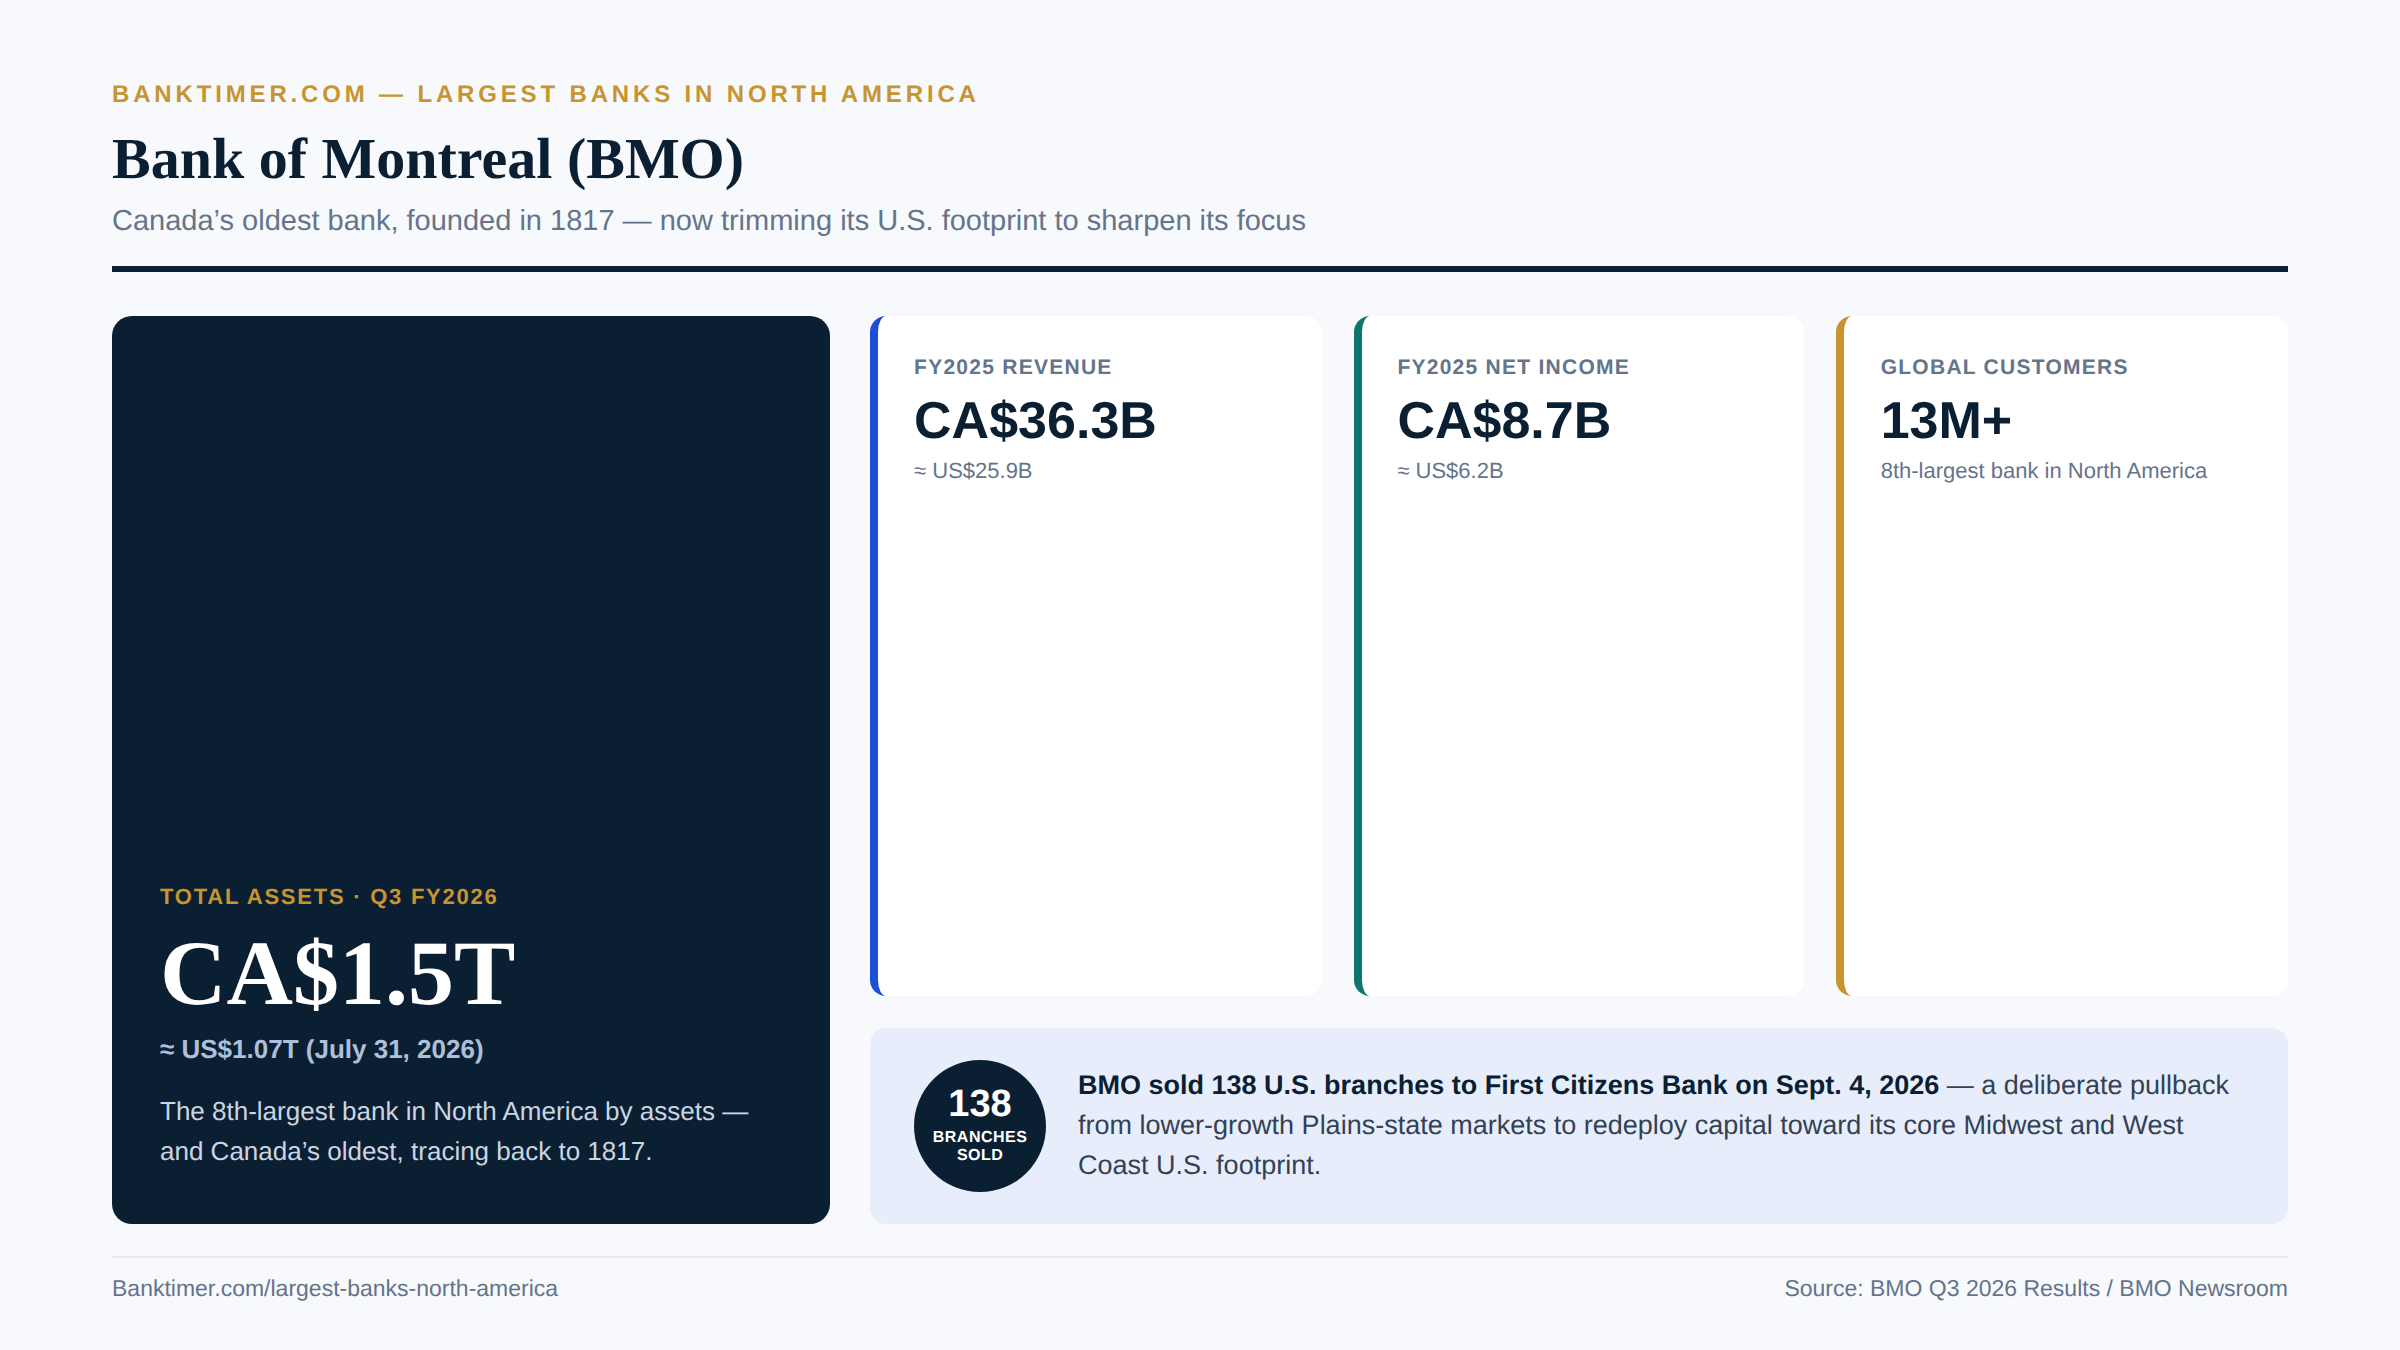
Canada’s oldest bank is actively shrinking its U.S. footprint, not growing it
How the 18 Largest Banks Compare
Side by side, the largest banks in North America fall into a handful of clear peer groups. You’ve just read full profiles of all 18 largest banks in North America, from JPMorgan Chase’s $5.02 trillion balance sheet down to BMO’s two-century history as Canada’s oldest bank. Numbers this big lose meaning without a side-by-side view, so here it is. Below are five peer-group tables that measure each bank against its real competitors, plus one master table showing where all 18 land at a glance.
Use these tables to sanity-check any single bank’s story against the group it actually competes in. A custodian bank’s $50 trillion-plus in assets under custody measures something completely different from a money-center bank’s balance sheet, and the categories below keep that distinction intact on purpose.
U.S. Money-Center G-SIBs
| Bank | Total Assets | Annual Revenue | Net Income | Customers/Proxy | Primary Specialty |
|---|---|---|---|---|---|
| JPMorgan Chase | $5.02T (Q2 2026) | $186.3B (TTM) | $63.6B (TTM) | 86.6 million U.S. consumers | Universal banking; #1 in U.S. deposits and credit cards |
| Bank of America | $3.50T (Q2 2026) | $113.9B (TTM) | $32.1B (TTM) | ~70 million clients | Retail banking plus Merrill wealth management |
| Citigroup | $2.89T (Q2 2026) | $81.7B (TTM) | $16.46B (TTM) | ~19,000 institutional clients in 180+ countries | Global transaction banking and institutional services |
| Wells Fargo | $2.2T (Q2 2026 avg.) | $83.0B (TTM) | $21.6B (TTM) | 33 million active mobile users | Full-service consumer bank, newly free of consent orders |
U.S. Super-Regionals
| Bank | Total Assets | Annual Revenue | Net Income | Customers/Proxy | Primary Specialty |
|---|---|---|---|---|---|
| U.S. Bancorp | $692B (FY2025 year-end) | $28.7B (FY2025) | $7.57B (FY2025) | 70,000 employees across 26 states | Largest U.S. super-regional; payments processing via Elavon |
| PNC Financial Services Group | $616.0B (Q2 2026) | $24.3B (TTM) | $7.26B (TTM) | ~2,200 branches | Super-regional banking plus $503B in asset management |
| Truist Financial | $556.0B (Q2 2026) | $19.0B (TTM) | $5.53B (TTM) | 15 million clients | Southeast and Mid-Atlantic super-regional |
| Fifth Third Bancorp | $300.1B (Q2 2026) | $3.28B (Q2 2026)* | $801M (Q2 2026)* | 1,500 banking centers | Midwest super-regional, freshly merged with Comerica |
| Citizens Financial Group | $233.8B (Q2 2026) | $2.28B (Q2 2026)* | $587M (Q2 2026)* | ~1,000 branches in 14 states | Northeast super-regional plus a growing private bank |
*Fifth Third and Citizens both went through major changes in 2026 — a completed merger and a fast-growing private bank, respectively. Their figures above show the most recent quarter, not a trailing-twelve-month total, since a clean annual comparison isn’t available yet.
U.S. Card and Investment Specialists
| Bank | Total Assets | Annual Revenue | Net Income | Customers/Proxy | Primary Specialty |
|---|---|---|---|---|---|
| Capital One | $673.8B (Q2 2026) | $48.1B (TTM) | $10.2B (TTM) | Largest U.S. credit card issuer | Card and consumer-finance specialist; owns the Discover network |
| Goldman Sachs | $1.81T (FY2025) | $67.6B (TTM) | $20.0B (TTM) | Institutional and ultra-high-net-worth clients | Global investment bank and M&A advisory |
| Morgan Stanley | $1.42T (FY2025 year-end) | $70.6B (FY2025) | $16.9B (FY2025) | $10 trillion+ in total client assets | Wealth management plus investment banking |
U.S. Custody/Trust and Brokerage Specialists
| Bank | Total Assets | Annual Revenue | Net Income | Customers/Proxy | Primary Specialty |
|---|---|---|---|---|---|
| Charles Schwab | $491.0B (bank, Q4 2025) | $23.9B (FY2025) | $8.9B (FY2025) | 46.5 million client accounts; $11.9T in client assets | Brokerage and independent-advisor custody |
| State Street | $371.1B (Q3 2025) | $15.0B (TTM) | $3.22B (TTM) | $53.8 trillion in assets under custody/administration | Institutional custody plus the SPDR ETF franchise |
| BNY | $472.3B (FY2025) | $20.1B (FY2025) | ~$5.4B (FY2025) | $59.3 trillion in assets under custody/administration | World’s largest custodian bank |
Canada’s Big Three
| Bank | Total Assets | Annual Revenue | Net Income | Customers/Proxy | Primary Specialty |
|---|---|---|---|---|---|
| Royal Bank of Canada (RBC) | $1.79T USD (Q3 FY2026) | $47.6B USD (FY2025) | $14.6B USD (FY2025) | 19 million+ clients | Canada’s largest, most diversified bank |
| TD Bank Group | $1.51T USD (Q3 FY2026) | $48.5B USD (FY2025) | $14.7B USD (FY2025) | 28.2 million customers | Largest U.S. branch network of the Canadian banks; under a U.S. asset cap |
| BMO Financial Group | $1.07T USD (Q3 FY2026) | $25.9B USD (FY2025) | $6.2B USD (FY2025) | 13 million customers | Canada’s oldest bank; Midwest and West Coast U.S. footprint |
RBC, TD, and BMO report in Canadian dollars on an October 31 fiscal year-end. Figures above are converted to USD at the September 16, 2026 mid-market rate of 1 USD = 1.3988 CAD for easier comparison with the U.S. banks in this guide; the original CAD figures remain the authoritative source.
The Master Comparison Table: All 18 Banks
| # | Bank | Country | Total Assets | Customers/Proxy | One-Line Specialty |
|---|---|---|---|---|---|
| 1 | JPMorgan Chase | US | $5.02T | 86.6M consumers | Largest U.S. bank; universal banking leader |
| 2 | Bank of America | US | $3.50T | ~70M clients | Retail banking plus Merrill wealth management |
| 3 | Citigroup | US | $2.89T | ~19,000 institutional clients | Global transaction banking specialist |
| 4 | Wells Fargo | US | $2.2T | 33M mobile users | Full-service consumer bank, post-consent-order |
| 5 | U.S. Bancorp | US | $692B | 26-state footprint | Largest super-regional; payments via Elavon |
| 6 | PNC Financial Services Group | US | $616.0B | ~2,200 branches | Super-regional plus $503B asset management |
| 7 | Truist Financial | US | $556.0B | 15M clients | Southeast/Mid-Atlantic super-regional |
| 8 | Capital One | US | $673.8B | Largest card issuer | Card specialist; owns the Discover network |
| 9 | Goldman Sachs | US | $1.81T | Institutional/UHNW clients | Global investment bank |
| 10 | Morgan Stanley | US | $1.42T | $10T+ client assets | Wealth management plus investment banking |
| 11 | State Street | US | $371.1B | $53.8T AUC/A | Institutional custody plus SPDR ETFs |
| 12 | Bank of New York Mellon (BNY) | US | $472.3B | $59.3T AUC/A | World’s largest custodian bank |
| 13 | Charles Schwab | US | $491.0B | 46.5M accounts | Brokerage and RIA custody specialist |
| 14 | Fifth Third Bancorp | US | $300.1B | 1,500 banking centers | Midwest super-regional, post-Comerica |
| 15 | Citizens Financial Group | US | $233.8B | ~1,000 branches | Northeast super-regional plus private bank |
| 16 | Royal Bank of Canada (RBC) | Canada | $1.79T | 19M+ clients | Canada’s largest, most diversified bank |
| 17 | TD Bank Group | Canada | $1.51T | 28.2M customers | Largest Canadian-bank U.S. footprint; under an asset cap |
| 18 | Bank of Montreal (BMO) | Canada | $1.07T | 13M customers | Canada’s oldest bank |
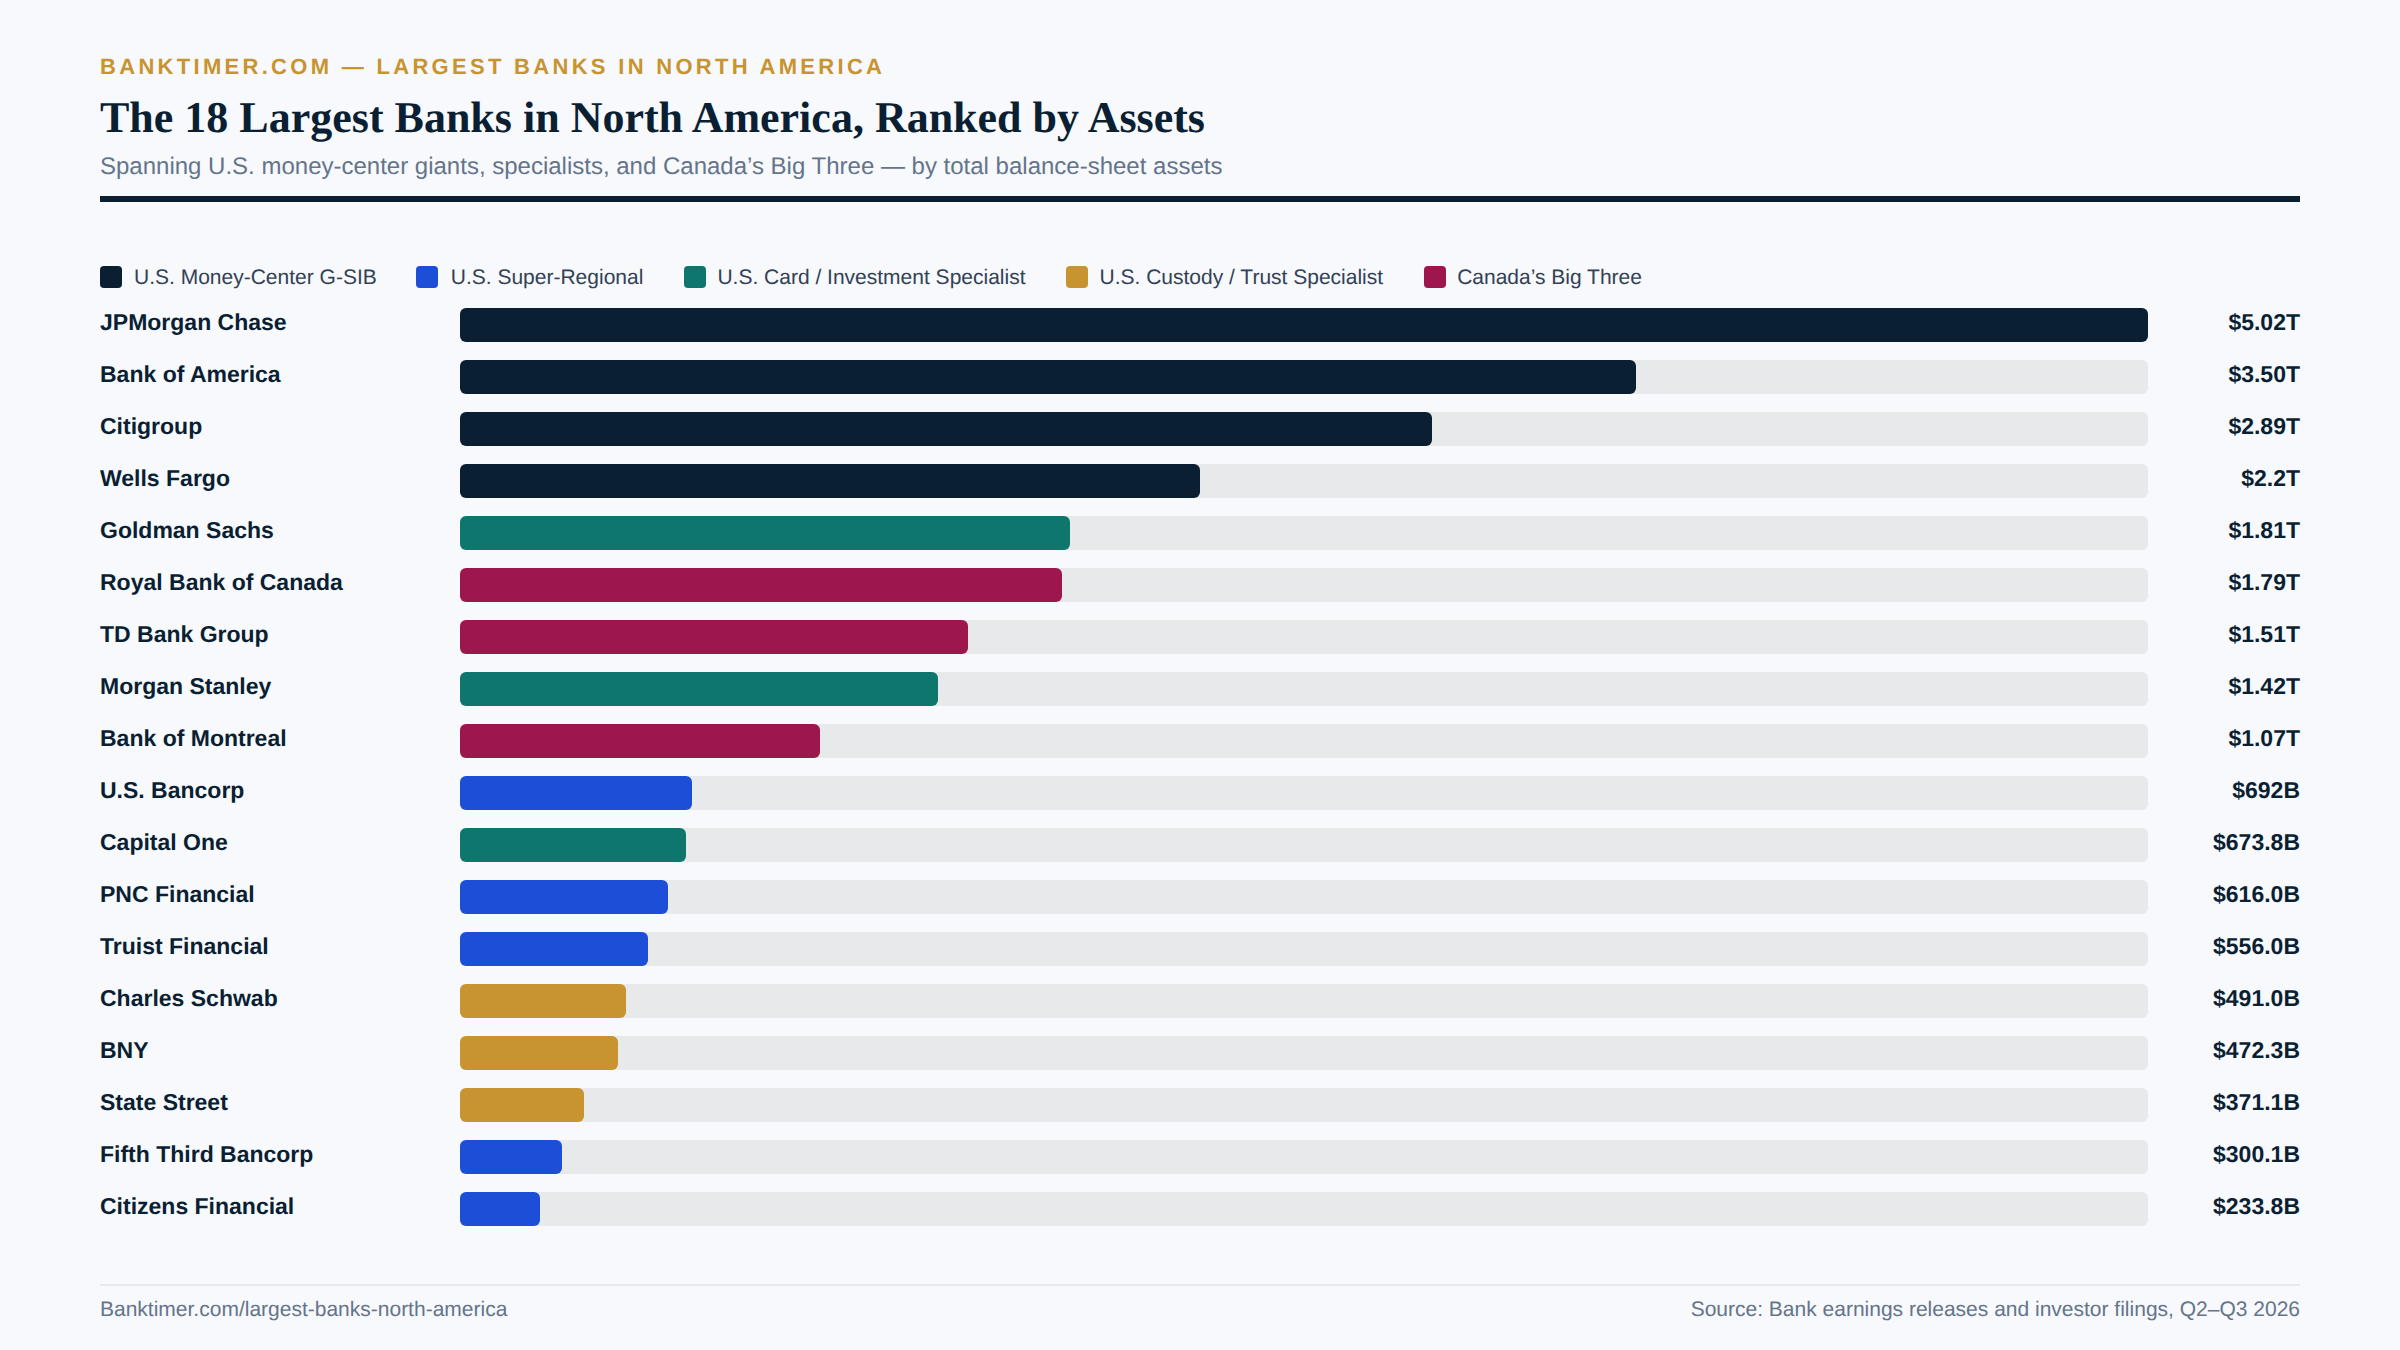
18 banks, one chart — from JPMorgan’s $5 trillion down to Citizens’ $234 billion
A 2026 Snapshot of North American Banking
Zoom out, and the largest banks in North America are moving through one of their busiest stretches in years. Banking in 2026 has a new backdrop: rising rates. On September 16, 2026, the Federal Reserve raised its benchmark rate a quarter point, to a target range of 3.75%–4.00%. Prime Rate — the reference point most banks use for variable-rate loans and credit lines — moved to 7.00% the next day, confirmed directly by PNC’s own rate-change notice. That single vote touches nearly every bank in this guide, from JPMorgan’s card pricing to the smallest super-regional’s business line of credit.
The bigger 2025–2026 story is consolidation. Capital One closed its $35.3 billion acquisition of Discover in May 2025, instantly making it the largest U.S. credit card issuer and one of the few banks that owns its own payment network outright. Fifth Third closed its $10.9 billion Comerica deal in barely four months, crossing $300 billion in assets and a new regulatory category along the way. Charles Schwab finished folding TD Ameritrade’s clients and technology onto its own platform, retiring the standalone thinkorswim brand as a separate product. Three of the 18 largest banks in North America profiled here changed shape materially within the past 18 months — a reminder that “biggest” is a moving target, not a fixed list.
Regulatory fortune split sharply between two of this guide’s biggest names. Wells Fargo spent seven years under a Federal Reserve asset cap and, as of March 2026, is free of every consent order tied to its 2016 sales-practices scandal, the first time in roughly 15 years. TD Bank Group sits at the opposite end: its U.S. banking subsidiaries remain frozen at a $434 billion asset ceiling under an October 2024 anti-money-laundering settlement, with remediation milestones stretching into 2027. Same industry, same year, two very different regulatory stories.
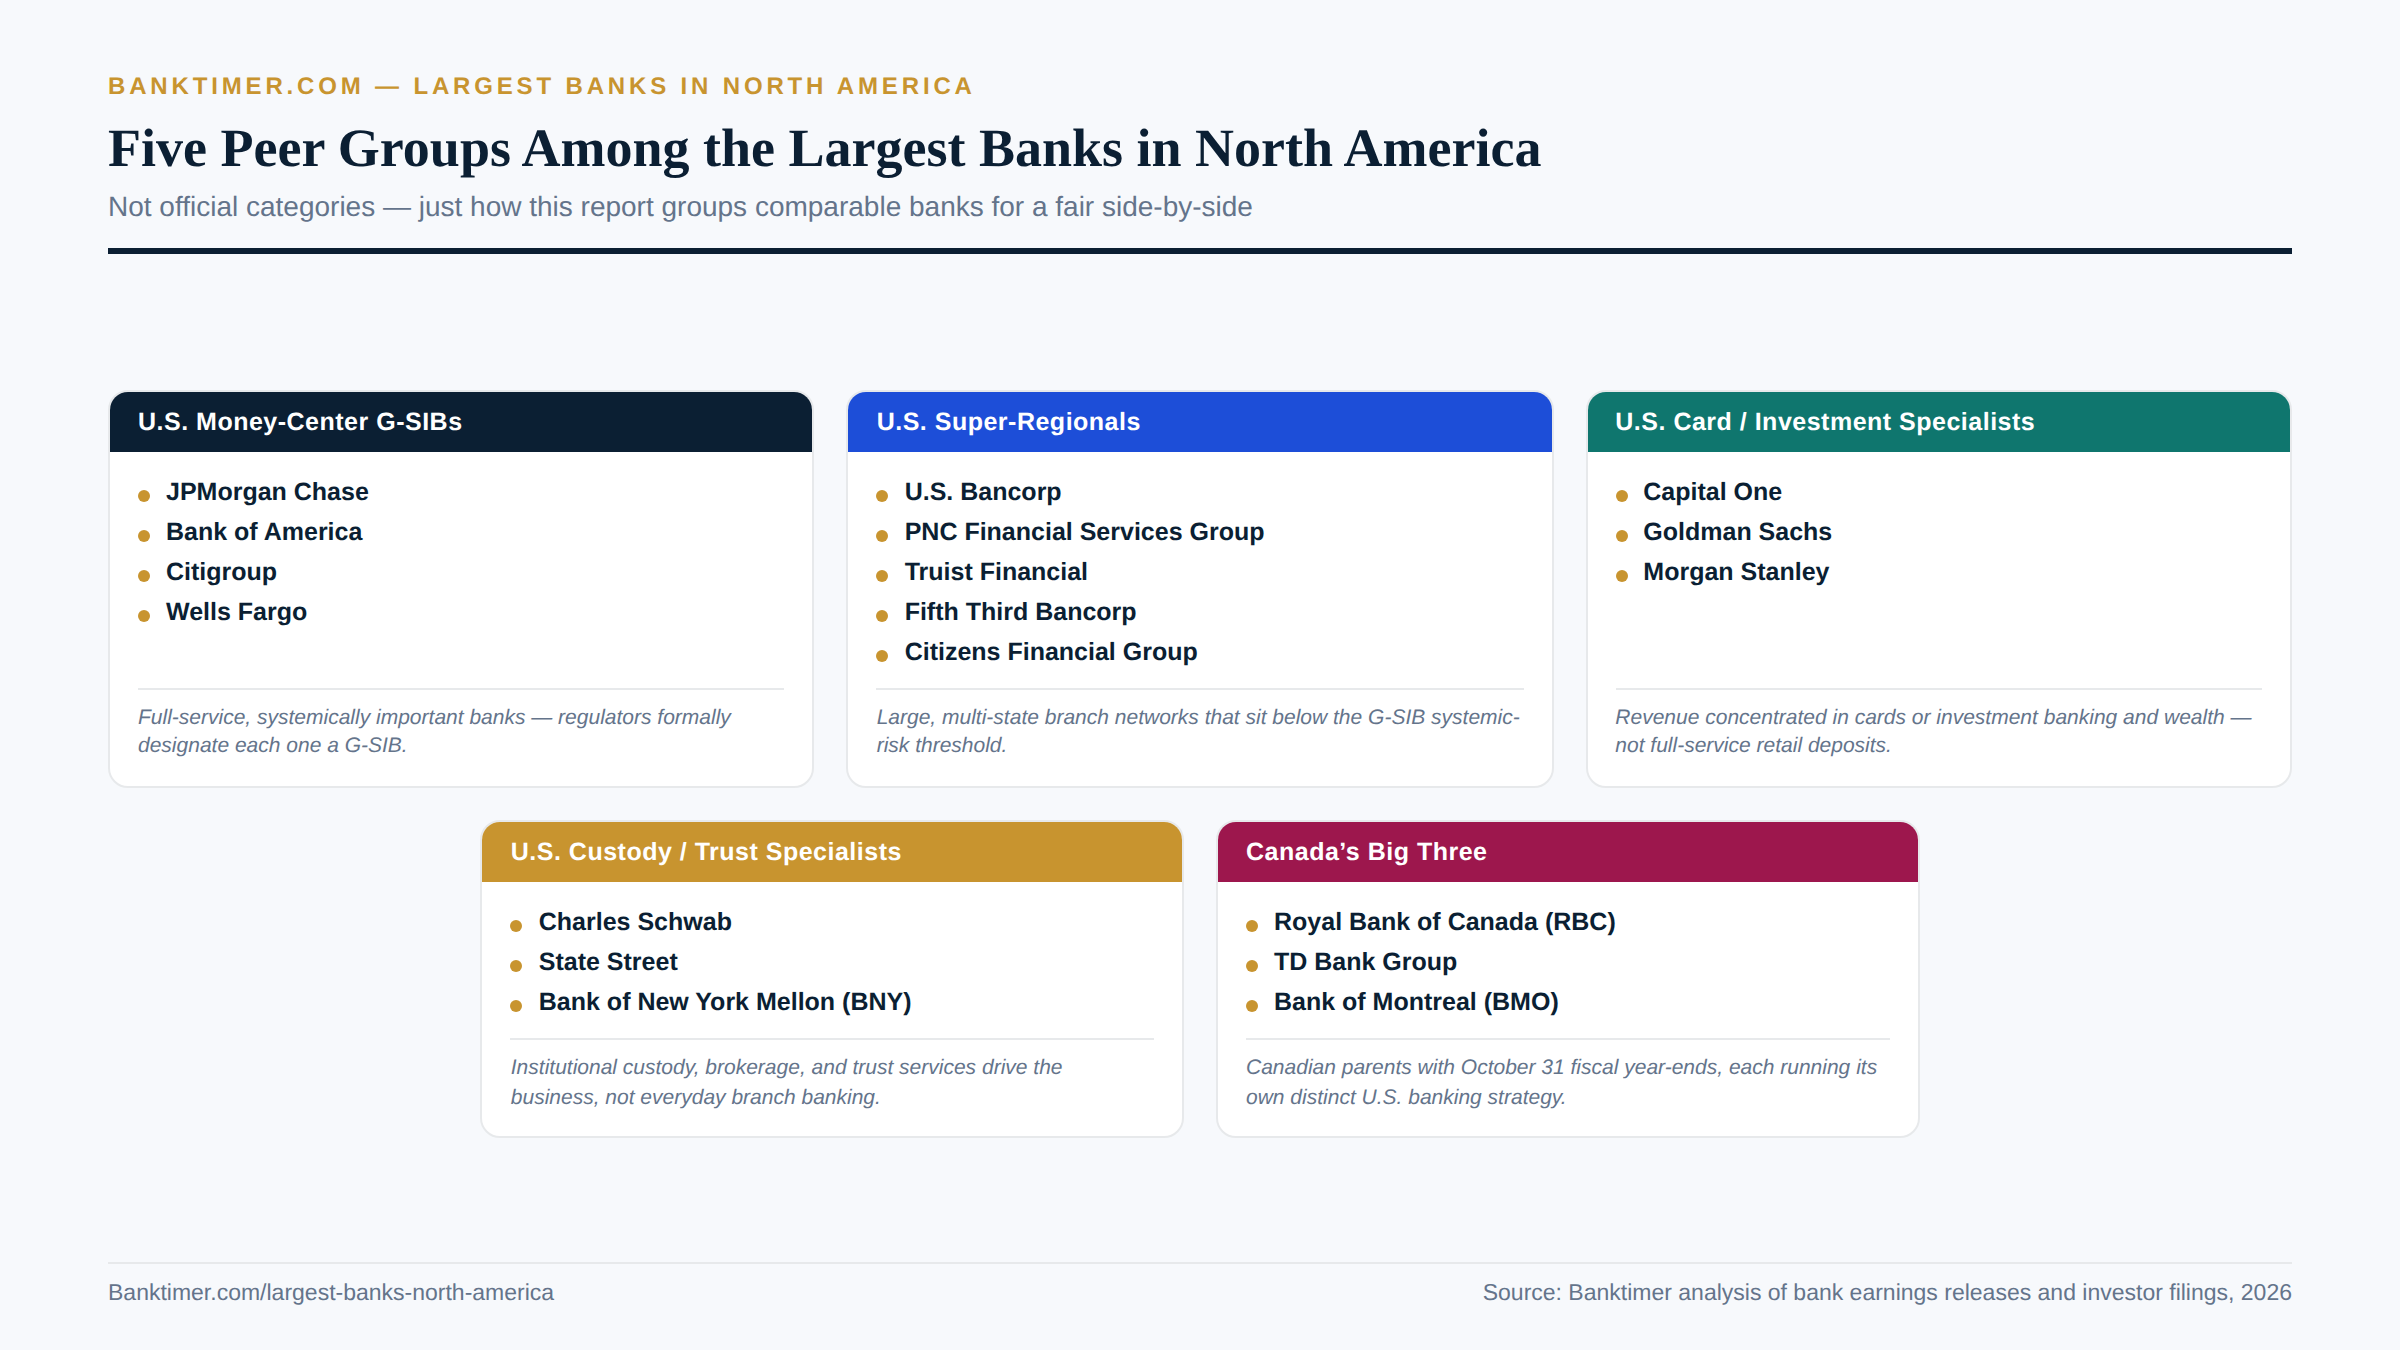
Five ways to group 18 very different banks — from G-SIBs to Canada’s Big Three
How to Prioritize This Guide for Your Situation
Not every reader needs the same slice of the largest banks in North America. ### If You’re an Everyday Retail Banking Customer
Your shortlist starts with the banks that actually want your checking account: JPMorgan Chase, Bank of America, Wells Fargo, and the super-regionals — U.S. Bancorp, PNC, Truist, Fifth Third, and Citizens. Each one runs a full branch network, a mobile app, and a fee schedule you can compare directly. If you live in the Southeast or Mid-Atlantic, Truist and PNC show up more often; in the Midwest, Fifth Third and U.S. Bancorp compete head-to-head. Skip the pure custody and investment banks entirely here — Goldman Sachs, Morgan Stanley, State Street, and BNY don’t offer everyday checking accounts to the general public.
If You’re a High-Net-Worth or Wealth-Management Client
Once your investable assets cross into six or seven figures, a different set of banks becomes relevant. Morgan Stanley’s Wealth Management arm now oversees $9.3 trillion in client assets, with Bank of America’s Merrill unit close behind at $4.9 trillion. Goldman Sachs and BNY Wealth both serve ultra-high-net-worth families and family offices directly, while Charles Schwab’s Advisor Services division is the backbone for many independent financial advisors. If you split time between the U.S. and Canada, RBC’s City National subsidiary specifically targets affluent entertainment, sports, and business-owner clients.
If You’re a Small Business Owner
Bank of America calls itself the country’s #1 small-business lender, serving 4 million small businesses directly — a reasonable starting point if you want one relationship for lending and deposits. U.S. Bancorp’s Elavon subsidiary is worth a look if payment processing matters as much as banking does. Citizens has built a deliberate strategy around the $5 million–$50 million revenue segment that larger banks often overlook. And if you run a venture-backed startup, Capital One’s 2026 acquisition of Brex brought an AI-native corporate-card and spend-management platform under one roof.
If You’re a Cross-Border US/Canada Banker
If you move money, or your life, between the two countries, the Canadian Big Three matter more than any single U.S. bank. TD Bank Group runs the largest U.S. branch network of the three — over 1,000 locations along the East Coast — though its growth there is currently frozen under a regulatory asset cap. BMO’s U.S. arm covers the Midwest and West Coast through its old Harris Bank and Bank of the West territory. RBC takes a narrower approach, offering dedicated cross-border accounts through RBC Bank USA while steering wealthier clients toward City National instead of a mass-market U.S. retail push.
If You’re an Investor Doing Due Diligence on Bank Stocks
Every profile in this guide includes stock performance, credit ratings, and profitability metrics like ROE and ROTCE — pull those numbers up side by side before you compare two bank stocks. Citigroup’s turnaround shows the widest swing, with net income nearly doubling from FY2023 to FY2025. Wells Fargo’s newly unrestricted balance sheet gives it room to grow that peers like JPMorgan never lost. And remember that a custodian bank like State Street or BNY trades on completely different logic than a lending-heavy bank does — its revenue tracks markets and asset values, not loan volume.
The Five Mistakes People Make When Judging “Biggest” Banks
Readers comparing the largest banks in North America tend to repeat the same handful of errors. 1. Confusing assets under custody with balance-sheet assets.
State Street holds $53.8 trillion in assets under custody and administration. BNY holds $59.3 trillion. Those figures dwarf JPMorgan Chase’s $5.02 trillion balance sheet — but they measure completely different things. AUC/A counts client securities a bank safeguards on someone else’s behalf; balance-sheet assets are what a bank actually owns and lends against. Compare like with like, or the comparison is meaningless.
2. Ignoring active regulatory constraints.
TD Bank Group’s U.S. subsidiaries are frozen at $434 billion in assets under an October 2024 anti-money-laundering settlement, with remediation running into 2027. A bank operating under a hard growth ceiling behaves differently than one that isn’t: slower expansion, tighter risk appetite, less room for new lending. Wells Fargo spent seven years under a similar Federal Reserve asset cap before it was lifted in June 2025. Always check whether “biggest” reflects a bank’s real capacity, or a number frozen in place by regulators.
3. Assuming bigger automatically means better rates or service.
J.D. Power’s 2026 studies didn’t crown a single money-center bank as the top performer in any of the 15 U.S. regions measured; regional players like Frost, Huntington, and Capital One topped individual markets instead. Charles Schwab Bank, meanwhile, has ranked #1 in direct-bank checking satisfaction for eight consecutive years, and it isn’t one of the four largest banks by assets. Size buys scale and stability. It doesn’t buy the best savings rate or the shortest hold time.
4. Conflating a bank’s U.S. operations with its Canadian or global footprint.
TD Bank Group is one of Canada’s largest banks, but TD Bank, N.A. — its U.S. retail arm — ranks only 15th among U.S. banks by deposits. RBC is Canada’s largest bank overall, yet its U.S. presence is a boutique private bank (City National) with roughly $98 billion in assets, a fraction of RBC’s $1.79 trillion global balance sheet. Citigroup runs the reverse pattern: a modest 650 U.S. branches alongside operations spanning 180-plus countries. Know which footprint you’re actually evaluating.
5. Ignoring which specialty actually matters for your own needs.
Goldman Sachs and Morgan Stanley are titans of investment banking and wealth management, and neither one will open you a free checking account with a debit card. State Street and BNY are the two biggest custodian banks on Earth, and neither has a branch you can walk into. This guide’s 18 largest banks in North America include money-center giants, super-regionals, card specialists, custodians, and Canada’s Big Three — and the one that’s “best” depends entirely on whether you need a mortgage, a trading desk, or a place to safeguard institutional securities.
Questions to Ask Yourself Before Choosing Any of These Banks
Before you choose, check every item
- Do I need everyday branch banking, or would a digital-first or brokerage-linked account serve me better?
- Is this bank currently operating under any consent order or asset cap that could limit its growth or service quality?
- Does this bank’s primary specialty — retail, wealth, custody, cards, or investment banking — actually match what I need?
- If I’m comparing a Canadian bank, am I evaluating its Canadian operations, its U.S. subsidiary, or both?
- Have I checked this bank’s most recent credit ratings from at least one major agency, like S&P, Moody’s, or Fitch?
- Am I confusing a headline “assets under custody” figure with the bank’s actual balance-sheet size?
- Does my balance stay within FDIC (U.S.) or CDIC (Canada) insurance limits at this institution?
- Have I compared this bank’s fees and rates against at least one direct peer in the same category?
- If I’m a small-business owner, does this bank offer the specific lending, payments, or treasury tools my business actually uses?
- Am I relying on a bank’s own marketing, or have I checked an independent source, like J.D. Power, its 10-K, or its regulator’s website?
Who This Guide Suits
This guide suits anyone who wants a clear, sourced picture of the largest banks in North America before opening an account, moving money, or picking a stock. This guide suits almost anyone making a real decision about where to put money in the United States or Canada. It works for someone comparing checking accounts at JPMorgan Chase and Bank of America just as well as it works for a financial advisor deciding which custodian to recommend to a client. Small-business owners will find the lending and payments comparisons useful, and investors doing due diligence on bank stocks get side-by-side financials without digging through 18 separate 10-Ks. Cross-border families splitting time between the U.S. and Canada get a rare direct comparison of RBC, TD, and BMO’s very different U.S. strategies. Treat it as a reference to return to, not a single read.
Frequently Asked Questions
Which is the single largest bank in North America?
JPMorgan Chase, with $5.02 trillion in total assets as of Q2 2026. It’s the largest U.S. bank and larger than any Canadian bank in this guide, including Royal Bank of Canada.
Is a bigger bank automatically safer?
Not necessarily. Size affects diversification and regulatory scrutiny, but safety in the U.S. and Canada comes primarily from deposit insurance, not asset size. A small, well-capitalized bank with FDIC or CDIC coverage protects your deposits the same way a money-center giant does, up to the insured limit.
What does FDIC insurance actually cover?
FDIC insurance covers deposit accounts — checking, savings, CDs — up to $250,000 per depositor, per insured bank, per ownership category. It doesn’t cover investments held through a bank’s brokerage arm, like stocks or mutual funds, even when that brokerage sits inside an FDIC-insured institution.
What does CDIC insurance cover for a Canadian bank?
The Canada Deposit Insurance Corporation covers eligible deposits at member institutions like RBC, TD, and BMO, similarly capped per depositor per category. It doesn’t extend to a Canadian bank’s U.S. subsidiary — TD Bank, N.A.’s U.S. deposits fall under FDIC coverage instead.
Why do custodian banks like State Street and BNY have almost no branches?
Because they don’t serve retail depositors. State Street and BNY hold $53.8 trillion and $59.3 trillion, respectively, in assets under custody for institutional clients — asset managers, pension funds, insurers — not individual checking accounts. Their entire business model runs through institutional relationships, not walk-in branches.
Is TD Bank still under a U.S. regulatory asset cap?
Yes. As of September 2026, TD’s combined U.S. banking subsidiaries remain frozen at $434 billion in total assets under an October 2024 settlement with U.S. regulators over anti-money-laundering failures. TD’s own disclosures point to remediation milestones running into calendar 2027.
Did Capital One really become the largest credit card issuer in the U.S.?
Yes. Capital One’s $35.3 billion acquisition of Discover closed in May 2025, combining Capital One’s card portfolio with Discover’s loans and its own payment network. The deal made Capital One the largest U.S. credit card issuer by loans outstanding.
Is Wells Fargo still under any consent orders?
No. The Federal Reserve terminated Wells Fargo’s final outstanding consent order on March 5, 2026, ending a stretch that began with 14 separate orders in 2019. Combined with the June 2025 removal of its asset cap, Wells Fargo entered 2026 with a clean regulatory slate for the first time in roughly 15 years.
What’s the difference between a G-SIB and a super-regional bank?
A G-SIB (Global Systemically Important Bank) is a designation for institutions so large and interconnected that their failure could threaten the wider financial system — JPMorgan, Bank of America, Citigroup, and Wells Fargo all carry this label. A super-regional bank, like U.S. Bancorp or PNC, is large and multi-state but doesn’t meet that systemic-risk threshold.
Which of these banks is best for everyday checking and savings?
It depends on your location and habits, but the super-regionals and money-center banks in this guide — JPMorgan Chase, Bank of America, U.S. Bancorp, PNC, Truist, Fifth Third, and Citizens — all compete directly for everyday retail customers. Charles Schwab’s linked checking account is also worth a look if you already invest.
Which of these banks is best for wealth management?
Morgan Stanley ($9.3 trillion in wealth-management client assets) and Bank of America’s Merrill unit ($4.9 trillion) lead by scale. Goldman Sachs and BNY Wealth focus more narrowly on ultra-high-net-worth families, while Charles Schwab’s Advisor Services supports independent financial advisors rather than serving wealthy clients directly.
Can I bank with RBC, TD, or BMO if I live in the U.S.?
Yes, through their U.S. subsidiaries. TD Bank, N.A. runs over 1,000 branches along the East Coast; BMO Bank, N.A. covers the Midwest and West Coast; RBC’s U.S. presence is narrower, running mainly through the private-banking-focused City National.
Why does Citigroup have so few U.S. branches compared to JPMorgan or Bank of America?
Citigroup made a deliberate choice. It runs roughly 650 U.S. branches concentrated in six wealthy metro markets, betting its growth on global transaction banking and an advisory-focused retail model rather than nationwide branch density.
What happened with the Capital One-Discover merger?
Capital One announced the $35.3 billion all-stock deal in February 2024, won final regulatory approvals in April 2025, and closed the acquisition on May 18, 2025. It gave Capital One direct ownership of the Discover payment network, alongside Discover’s card and loan portfolio.
Is Charles Schwab a bank or a brokerage?
Both, structurally. Schwab is chartered as a savings and loan holding company with three depository institution subsidiaries, but its business runs brokerage-first — its roughly $491 billion balance sheet is dwarfed by the $11.9 trillion in total client assets it holds in brokerage accounts.
What’s assets under custody, and why is it so much bigger than a bank’s balance sheet?
Assets under custody (AUC/A) counts securities a bank safeguards, administers, or settles on behalf of clients — it doesn’t own those assets. That’s why State Street’s $53.8 trillion in AUC/A can sit alongside a balance sheet of just $371 billion: one measures client holdings, the other measures the bank’s own assets and liabilities.
Are these bank rankings based on global assets or just U.S. assets?
This guide uses each bank’s total consolidated assets, which for global banks like Citigroup and RBC includes operations well outside the U.S. or Canada. Where a bank discloses a separate domestic figure, its profile and comparison tables note it.
How often should I recheck these figures?
Quarterly earnings move fast — total assets, revenue, and net income can shift meaningfully every three months, especially for banks mid-merger like Fifth Third or Capital One. Treat every number in this guide as accurate as of its stated date, and pull the current figure from the bank’s own investor-relations page before making a decision based on it.
How to Verify These Numbers Yourself
Figures for the largest banks in North America change every quarter, so it’s worth knowing how to check them yourself. Every figure in this guide traces back to a bank’s own disclosures or a reputable financial data provider, but banking numbers age fast. For any U.S. bank, SEC EDGAR (sec.gov/edgar) hosts every 10-K and 10-Q filed, free and searchable by ticker. Each bank’s own investor-relations page usually posts quarterly earnings releases days before the formal SEC filing, often with cleaner summary tables. For Canadian banks, the Office of the Superintendent of Financial Institutions (OSFI) publishes regulatory capital and supervisory data, while each bank’s own investor-relations site carries its quarterly report to shareholders.
To confirm a bank’s actual deposit-insurance status, use the FDIC’s BankFind tool in the U.S. or the CDIC’s member list in Canada — both are free, and both take under a minute. For a broader comparative view across many institutions at once, subscription services like S&P Global Market Intelligence aggregate bank financials into a single searchable database, which is how much of this guide’s peer-group data was cross-checked. None of these sources requires paid access to confirm the basics: total assets, capital ratios, and insured status are all public information.
Building Your Own Bank Comparison Checklist
If you want to compare a bank that isn’t among this guide’s 18, use the same framework:
- Pull the bank’s most recent total assets, revenue, and net income directly from its 10-K or annual report.
- Check its primary specialty — retail, commercial, wealth, custody, or investment banking — before comparing it to a bank in a different category.
- Confirm its FDIC or CDIC insured status directly through the regulator’s own lookup tool.
- Look up its credit ratings from at least one of S&P, Moody’s, or Fitch.
- Search for any active consent order, asset cap, or enforcement action through the OCC, Federal Reserve, CFPB, or OSFI’s public enforcement pages.
- Compare its fee schedule and rates against a same-category peer, not against a bank in a completely different specialty.
Key Terminology
A few recurring terms show up across every profile of the largest banks in North America in this guide. | Term | What it means |
|—|—|
| G-SIB | A Global Systemically Important Bank — an institution so large and interconnected that regulators subject it to extra capital and oversight requirements. |
| Money-center bank | A large, nationally focused bank headquartered in a major financial center, typically offering the full range of consumer, commercial, and investment banking services. |
| Super-regional bank | A bank operating across multiple states with a large branch network, but below the asset threshold and systemic designation of a G-SIB. |
| Custodian bank | An institution that safeguards, settles, and administers securities on behalf of institutional clients rather than taking retail deposits. |
| AUC/A | Assets Under Custody/Administration — the value of client securities a custodian bank holds and services, distinct from its own balance-sheet assets. |
| AUM | Assets Under Management — client money a firm actively invests and manages, typically for a fee based on the balance. |
| ROTCE | Return on Tangible Common Equity — a profitability measure showing how much profit a bank generates relative to its tangible shareholder equity. |
| ROE | Return on Equity — net income divided by total shareholder equity, a broad measure of how efficiently a bank uses its capital. |
| Net interest margin | The gap between what a bank earns on loans and investments and what it pays on deposits and borrowing, expressed as a percentage of earning assets. |
| CET1 ratio | Common Equity Tier 1 ratio — a core measure of a bank’s capital strength relative to its risk-weighted assets. |
| Tier 1 capital | A bank’s core capital, mainly common equity and retained earnings, used to absorb losses without triggering insolvency. |
| Consent order | A formal, legally binding agreement between a bank and its regulator requiring specific fixes to identified problems, often paired with a fine. |
| Asset cap | A regulatory limit freezing a bank’s total assets at a set level, typically imposed after serious compliance failures. |
| FDIC insurance | U.S. federal deposit insurance covering eligible bank accounts up to $250,000 per depositor, per bank, per ownership category. |
| CDIC insurance | The Canadian equivalent of FDIC insurance, protecting eligible deposits at member institutions up to a set limit per depositor category. |
| Senior unsecured credit rating | A grade from an agency like S&P, Moody’s, or Fitch reflecting a bank’s ability to repay its unsecured debt obligations. |
| Book value | A company’s total assets minus total liabilities, representing the accounting value of shareholder equity. |
| Tangible book value | Book value with intangible assets like goodwill stripped out, often used to judge a bank’s real liquidation-level worth. |
| Efficiency ratio | Noninterest expense divided by revenue — a lower ratio means a bank spends less to generate each dollar of income. |
| Net charge-off ratio | The percentage of a bank’s loan portfolio written off as uncollectible over a given period. |
| Diluted EPS | Earnings per share calculated as if all convertible securities and stock options were exercised, giving a conservative profit-per-share figure. |
| Bank holding company | A corporate structure that owns one or more banks, allowing the parent to also hold non-banking financial businesses under Federal Reserve oversight. |
| Fiscal year-end (Canadian banks) | Canada’s Big Six banks close their fiscal year on October 31, roughly two months ahead of the U.S. calendar-year convention. |
| TTM | Trailing Twelve Months — a rolling 12-month figure used to smooth out seasonal or quarterly swings in reported financials. |
| Prime Rate | The benchmark lending rate banks charge their most creditworthy customers, which moved to 7.00% following the Fed’s September 2026 hike. |
| Federal funds rate | The Federal Reserve’s target interest rate for overnight bank lending, set at 3.75%–4.00% after the September 16, 2026 increase. |
Banktimer Bottom Line
There’s no single “biggest” bank that fits every reader of this guide. JPMorgan Chase carries the largest balance sheet among the largest banks in North America, but that means nothing if what you actually need is a custodian for institutional securities, a wealth manager for a growing portfolio, or a small-business line of credit in Ohio. Match the bank to the job: money-center banks for full-service everyday banking, super-regionals for regional branch access, Capital One or the investment banks for cards and capital markets, State Street and BNY for institutional custody, and Canada’s Big Three if your life crosses the border. Check the current numbers yourself before you decide anything — banks this size change quarter to quarter, and a 2026 snapshot is a starting point, not a permanent verdict.
Sources
- Federal Reserve — FOMC Statement, September 16, 2026
- PNC Bank, N.A. — Prime Rate Change, September 16, 2026
- JPMorgan Chase — Q2 2026 Earnings Release
- Banking Dive — OCC Terminates JPMorgan Consent Order
- Bank of America — Q2 2026 Results
- CFPB — Bank of America Enforcement Action
- Citigroup — Q2 2026 Earnings Release
- American Banker — Citi Exits Consent Order
- Federal Reserve — Wells Fargo Asset Cap Removal Statement
- AdvisorHub — Wells Fargo Free of Consent Orders
- U.S. Bancorp — Fact Sheet
- PNC — Q2 2026 Earnings
- Truist — CEO Transition Announcement
- Capital One — Completes Acquisition of Discover
- Banking Dive — CFPB Drops Capital One Lawsuit
- Goldman Sachs — Investor Relations
- Morgan Stanley — Q2 2026 Earnings Release
- State Street — Q4/FY2025 Results
- BNY — Q4 2025 Earnings (SEC Exhibit)
- Charles Schwab — Q4/FY2025 Earnings Release
- Charles Schwab Bank — #1 J.D. Power Ranking, 8th Consecutive Year
- American Banker — Fifth Third Closes Comerica Acquisition
- CFPB — Fifth Third Enforcement Action
- Citizens Financial Group — Q2 2026 Earnings (SEC Filing)
- CFPB — Citizens Bank Enforcement Action
- Royal Bank of Canada — Q3 2026 Results
- RBC — Credit Ratings
- TD Bank Group — FY2025 Annual Report MD&A
- Federal Reserve — TD Bank Enforcement Action
- BMO Financial Group — Q3 2026 Results
- BMO — Completes Sale of 138 U.S. Branches to First Citizens Bank
- Bankrate — Biggest Banks in America Ranking
- J.D. Power — 2026 U.S. Retail Banking Satisfaction Study
- J.D. Power — 2025 Canada Retail Banking Satisfaction Study
- Checking Account: How It Works, What It Costs, and What to Check
Methodology
This guide profiles the largest banks in North America using a consistent method across all 18 institutions. We selected these 18 banks using a combination of asset size and market relevance, not a strict top-15-by-assets cutoff. That’s why custodian banks like State Street and BNY — whose own balance sheets are smaller than several regional banks — sit alongside money-center giants: their trillions in assets under custody make them genuinely systemically important, even though their balance sheets don’t show it. The same logic includes Goldman Sachs and Morgan Stanley as investment-banking and wealth-management leaders, and Charles Schwab as the largest brokerage-linked bank, rather than filling every U.S. slot with pure deposit-taking size.
Data comes primarily from each bank’s FY2025 annual report and its most recent 2026 quarterly filing available as of September 2026, cross-checked against each bank’s own investor-relations disclosures wherever possible. Figures like stock price, market capitalization, and 52-week trading ranges change constantly and should be treated as approximate, point-in-time snapshots taken around September 16–17, 2026, not current values. Canadian bank figures, originally reported in Canadian dollars on an October 31 fiscal year-end, are converted to USD at the September 16, 2026 mid-market rate for comparability; the original CAD figures remain the authoritative source.
Your next step
Pick the one bank from this guide closest to a decision you’re already facing — maybe you’re comparing checking accounts, maybe you’re deciding where a small business should bank, maybe you’re a Canadian moving south of the border. Pull up that bank’s own investor-relations page right now, and check its most recent quarterly total assets and any active regulatory actions against what you just read here. Five minutes of verification beats acting on a number that’s already a quarter or two stale.